Thank you for visiting my website!
Here you can find the slide deck we created to show case our process, results, and future work ideas.
Here you can find the poster we created to show case our process and main results.
Here you can find the formal paper we wrote.
Road traffic collisions are a serious and on-going threat to human life. Understanding the features of a collision that increase the likelihood of an injury is useful for increasing personal protection, guiding emergency services and advising municipal staff. This study analyzed traffic collisions in Ottawa, Ontario from 2017 to 2022. This study sought to highlight hazardous areas and modes of transportation, and to analyze correlations found with occurrences and severity of injuries. Despite limitations, this study provides actionable insights for local authorities to enhance road safety.
Several questions were analyzed for this project:
Part 1: Exploratory Analysis
Question 1) What were the most dangerous locations?
Question 2) When were accidents occurring?
Question 3) Which accident features were correlated to injuries?
Question 4) Were road/weather conditions correlated to levels of severity of injuries?
Question 5) Did injuries disproportionately affect drivers, pedestrians, bicyclers or motorcycles?
Question 6) Did traffic controls lead to decreases in accidents?
Part 2: Predicting Injuries
Question 7) Can an injury be predicted given collision information?
Here is a summary table for side-by-side comparison for the top 10 locations:
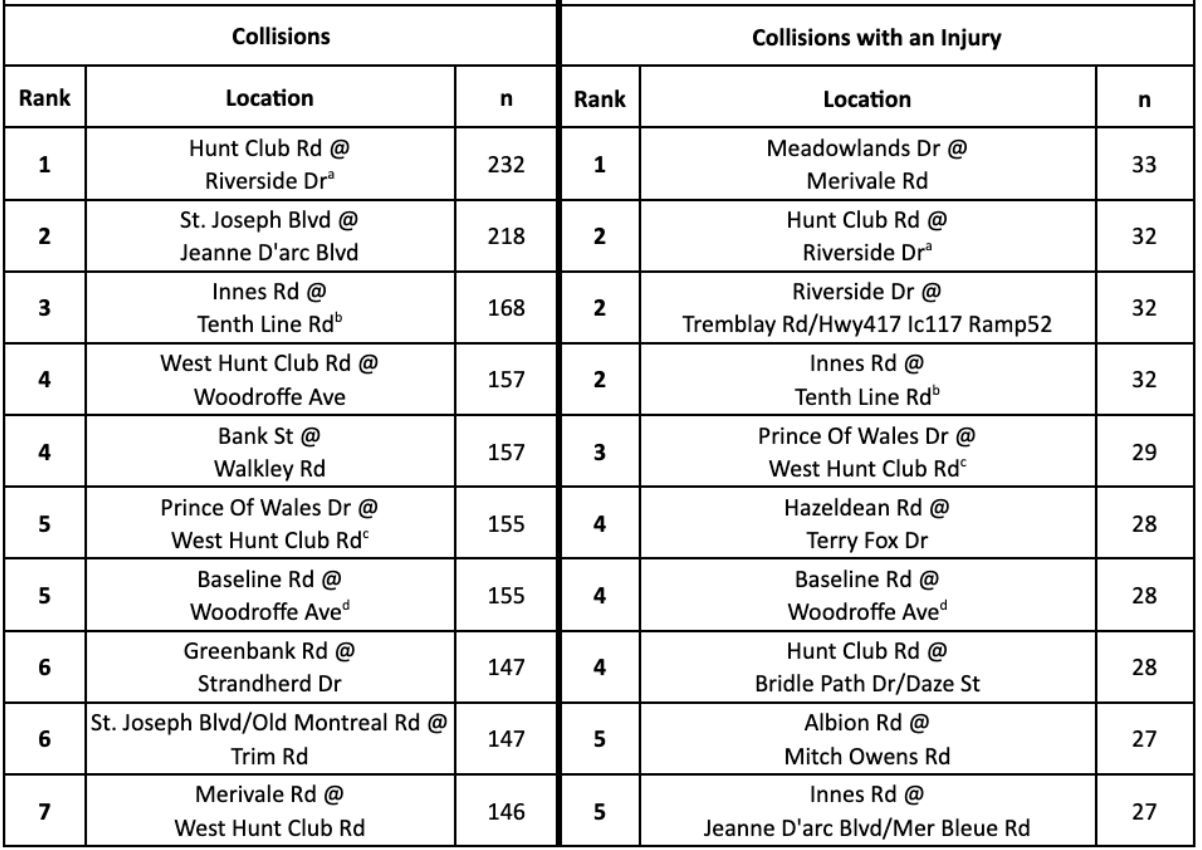
There are four locations that occur in both sets of top 10 locations:
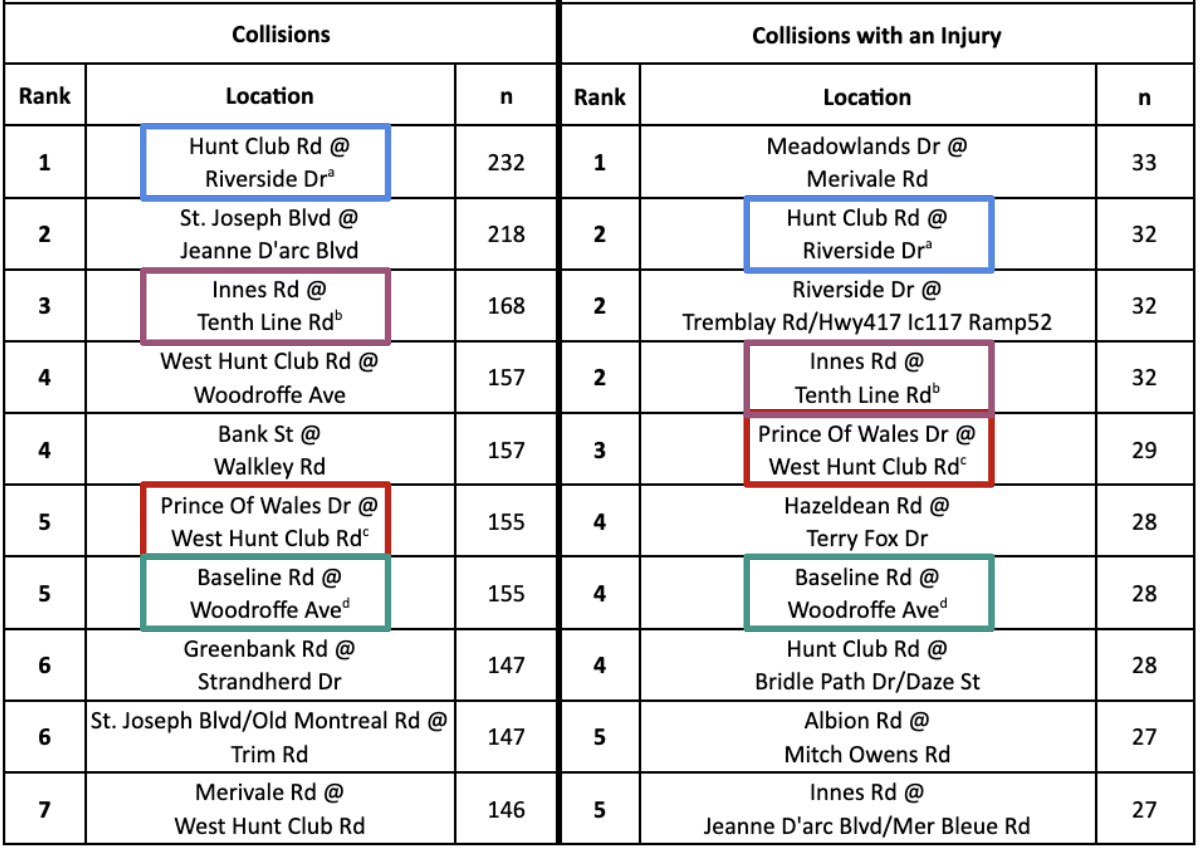
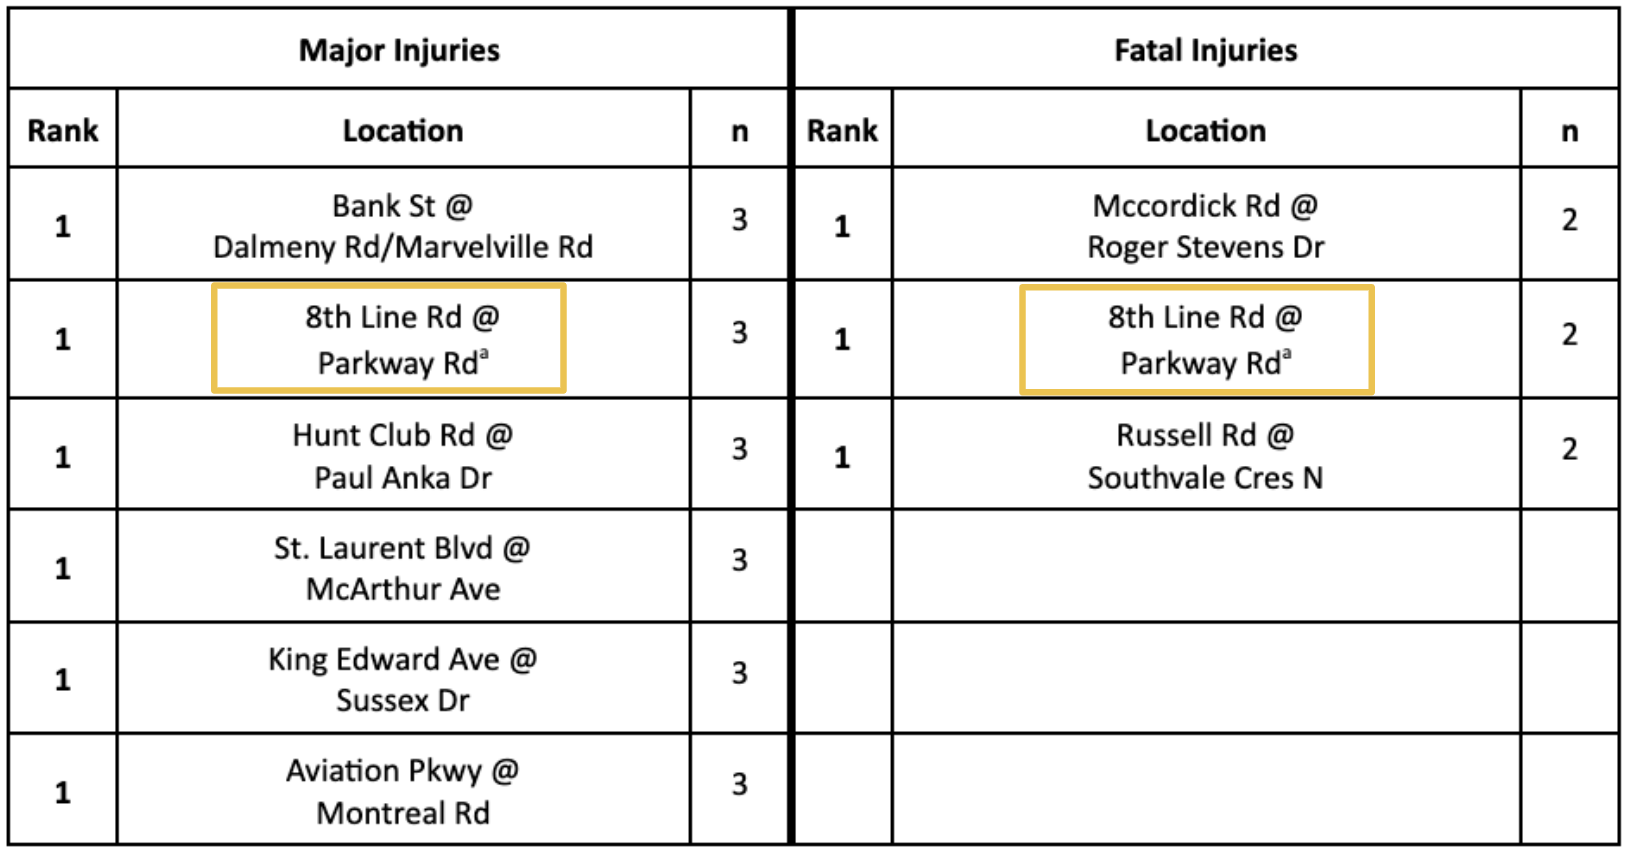
In terms of the most serious injury locations, we can see the following highlights the locations with the number of collisions that resulted in the injury severity (major or fatal).
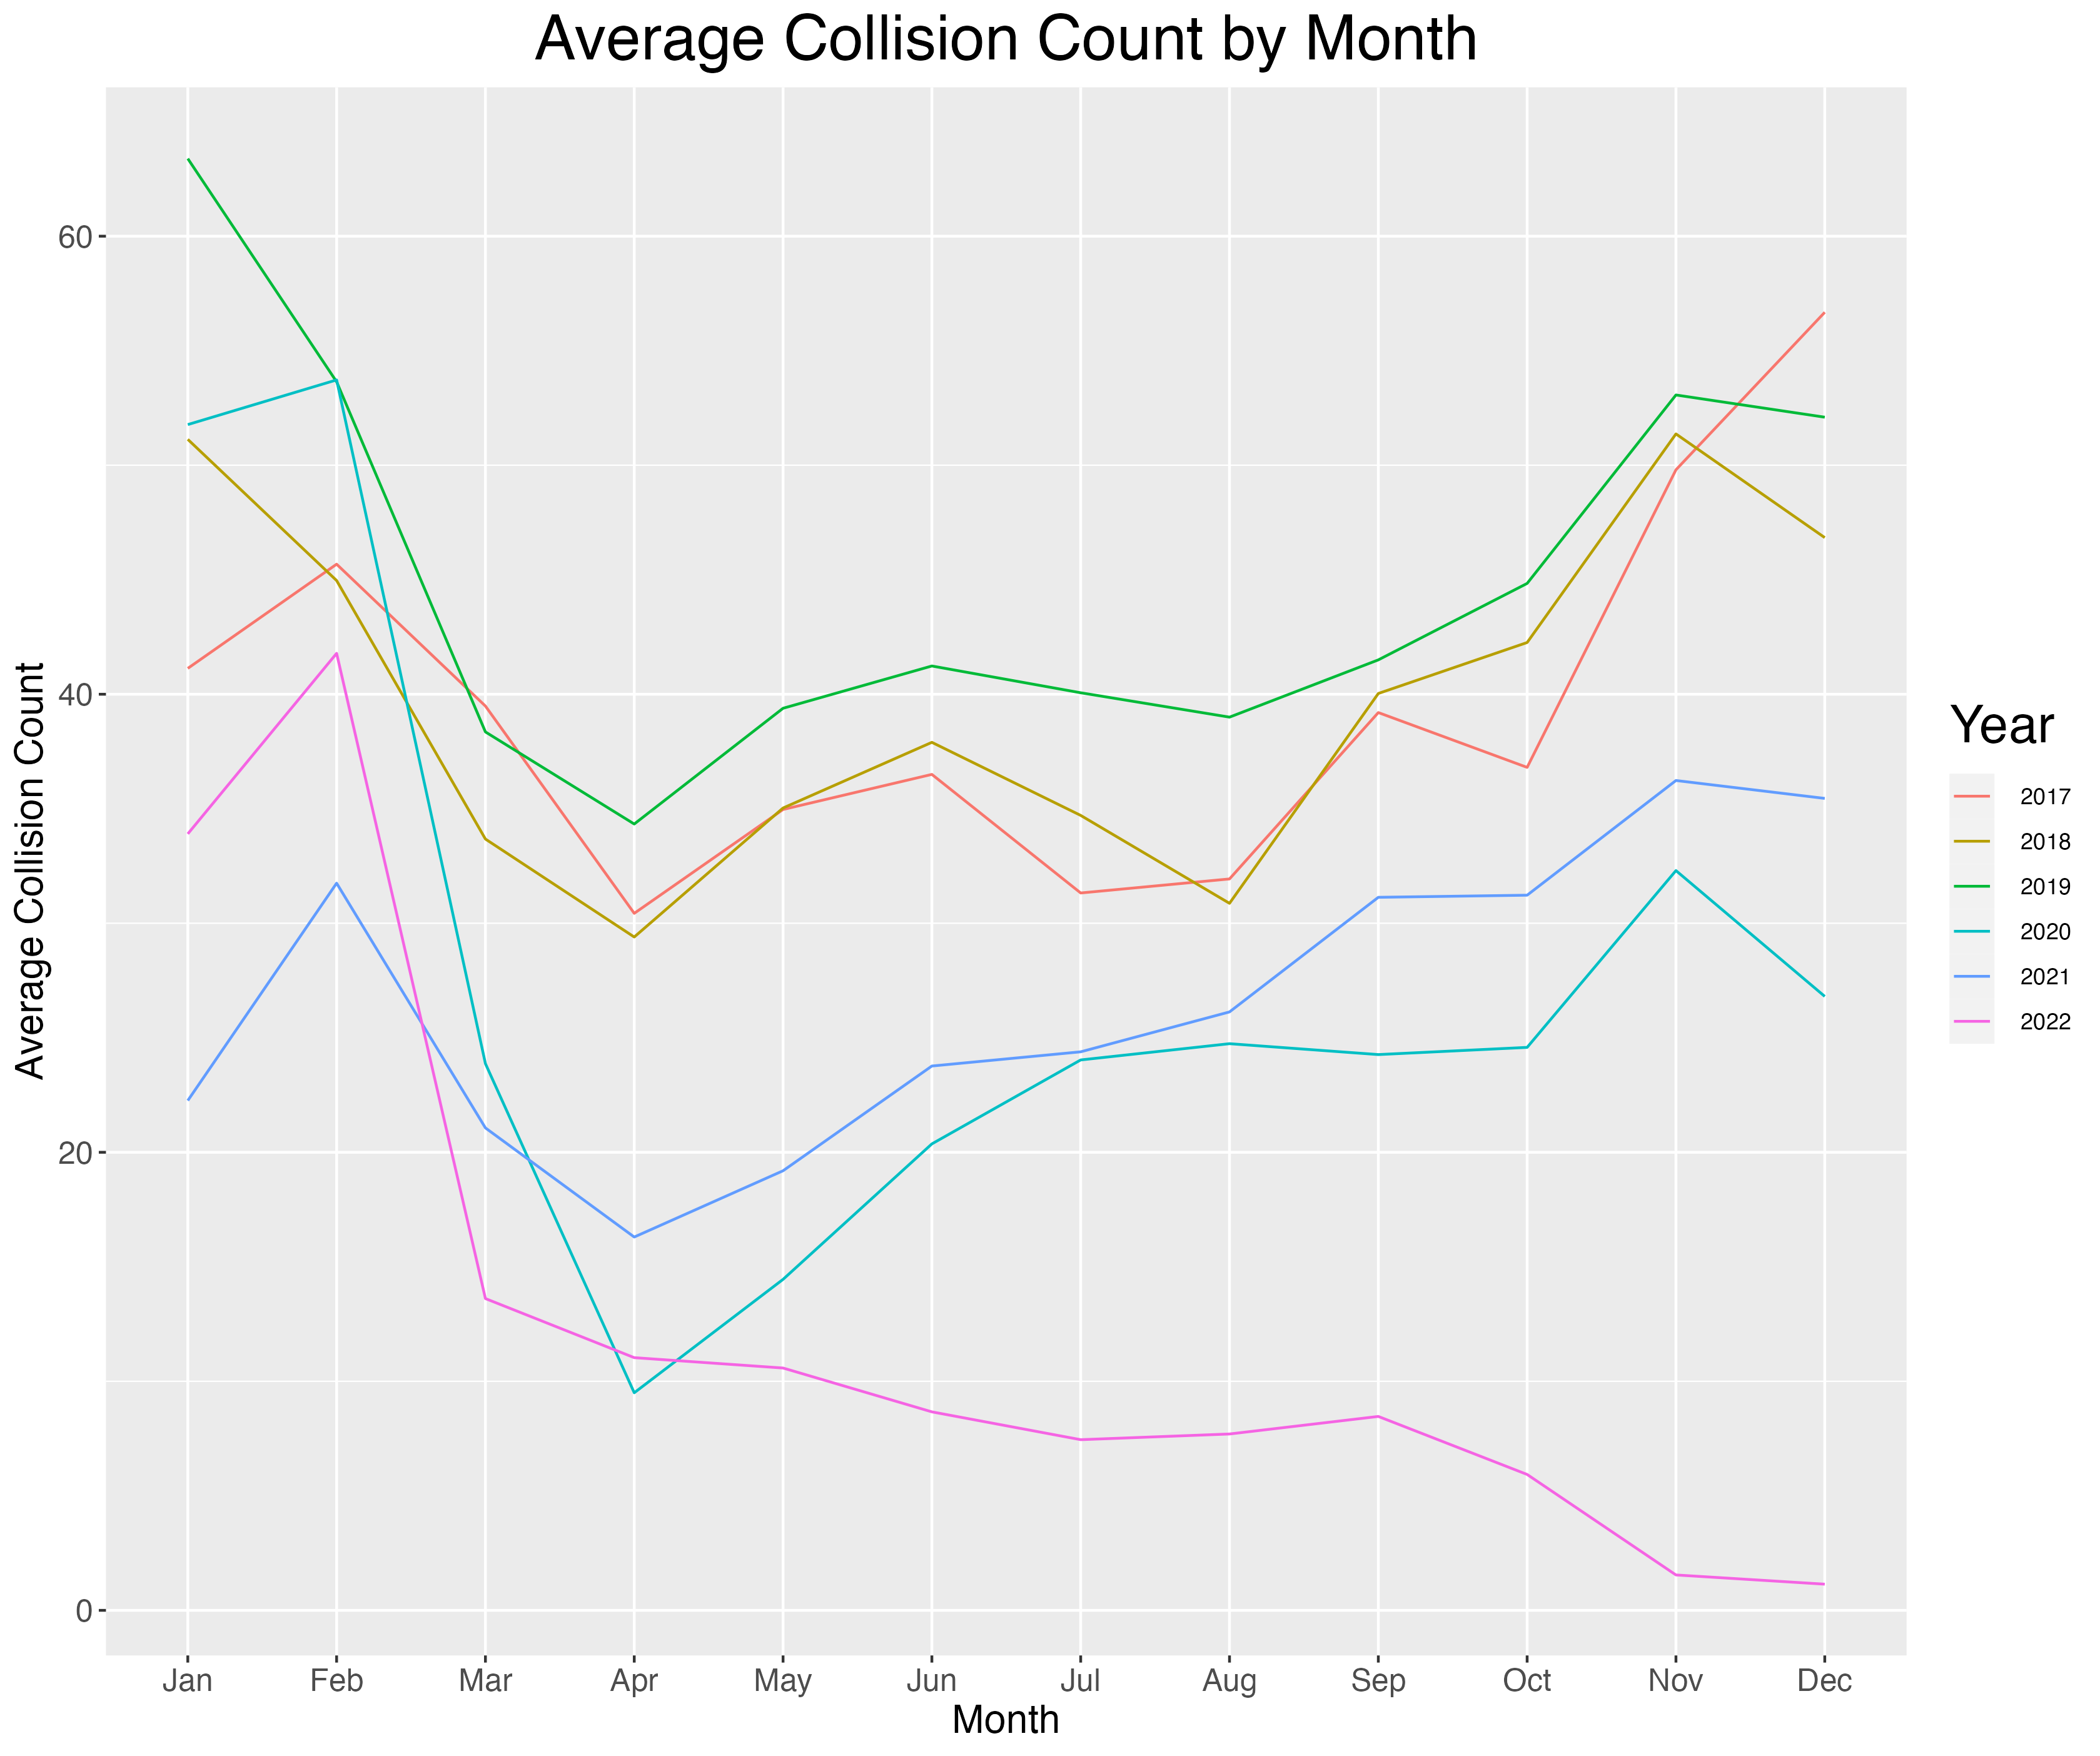
As can be seen, most years had similar trends of higher accidents in the winter. Also there was a substantial decrease in years 2020 and 2021; this coincides with the COVID shut downs.
Interesting to note that 2022 had a trend differing from the other years. When further analysis was done, there seemed to be fewer entries for those end of year months, implying this was a problem due to data entry - not due to a true collision trend for that year.

As can be seen, the highest correlation level (low to moderate positive correlation) coincides with the number of bicycles, pedestrians, and motorcyclists.
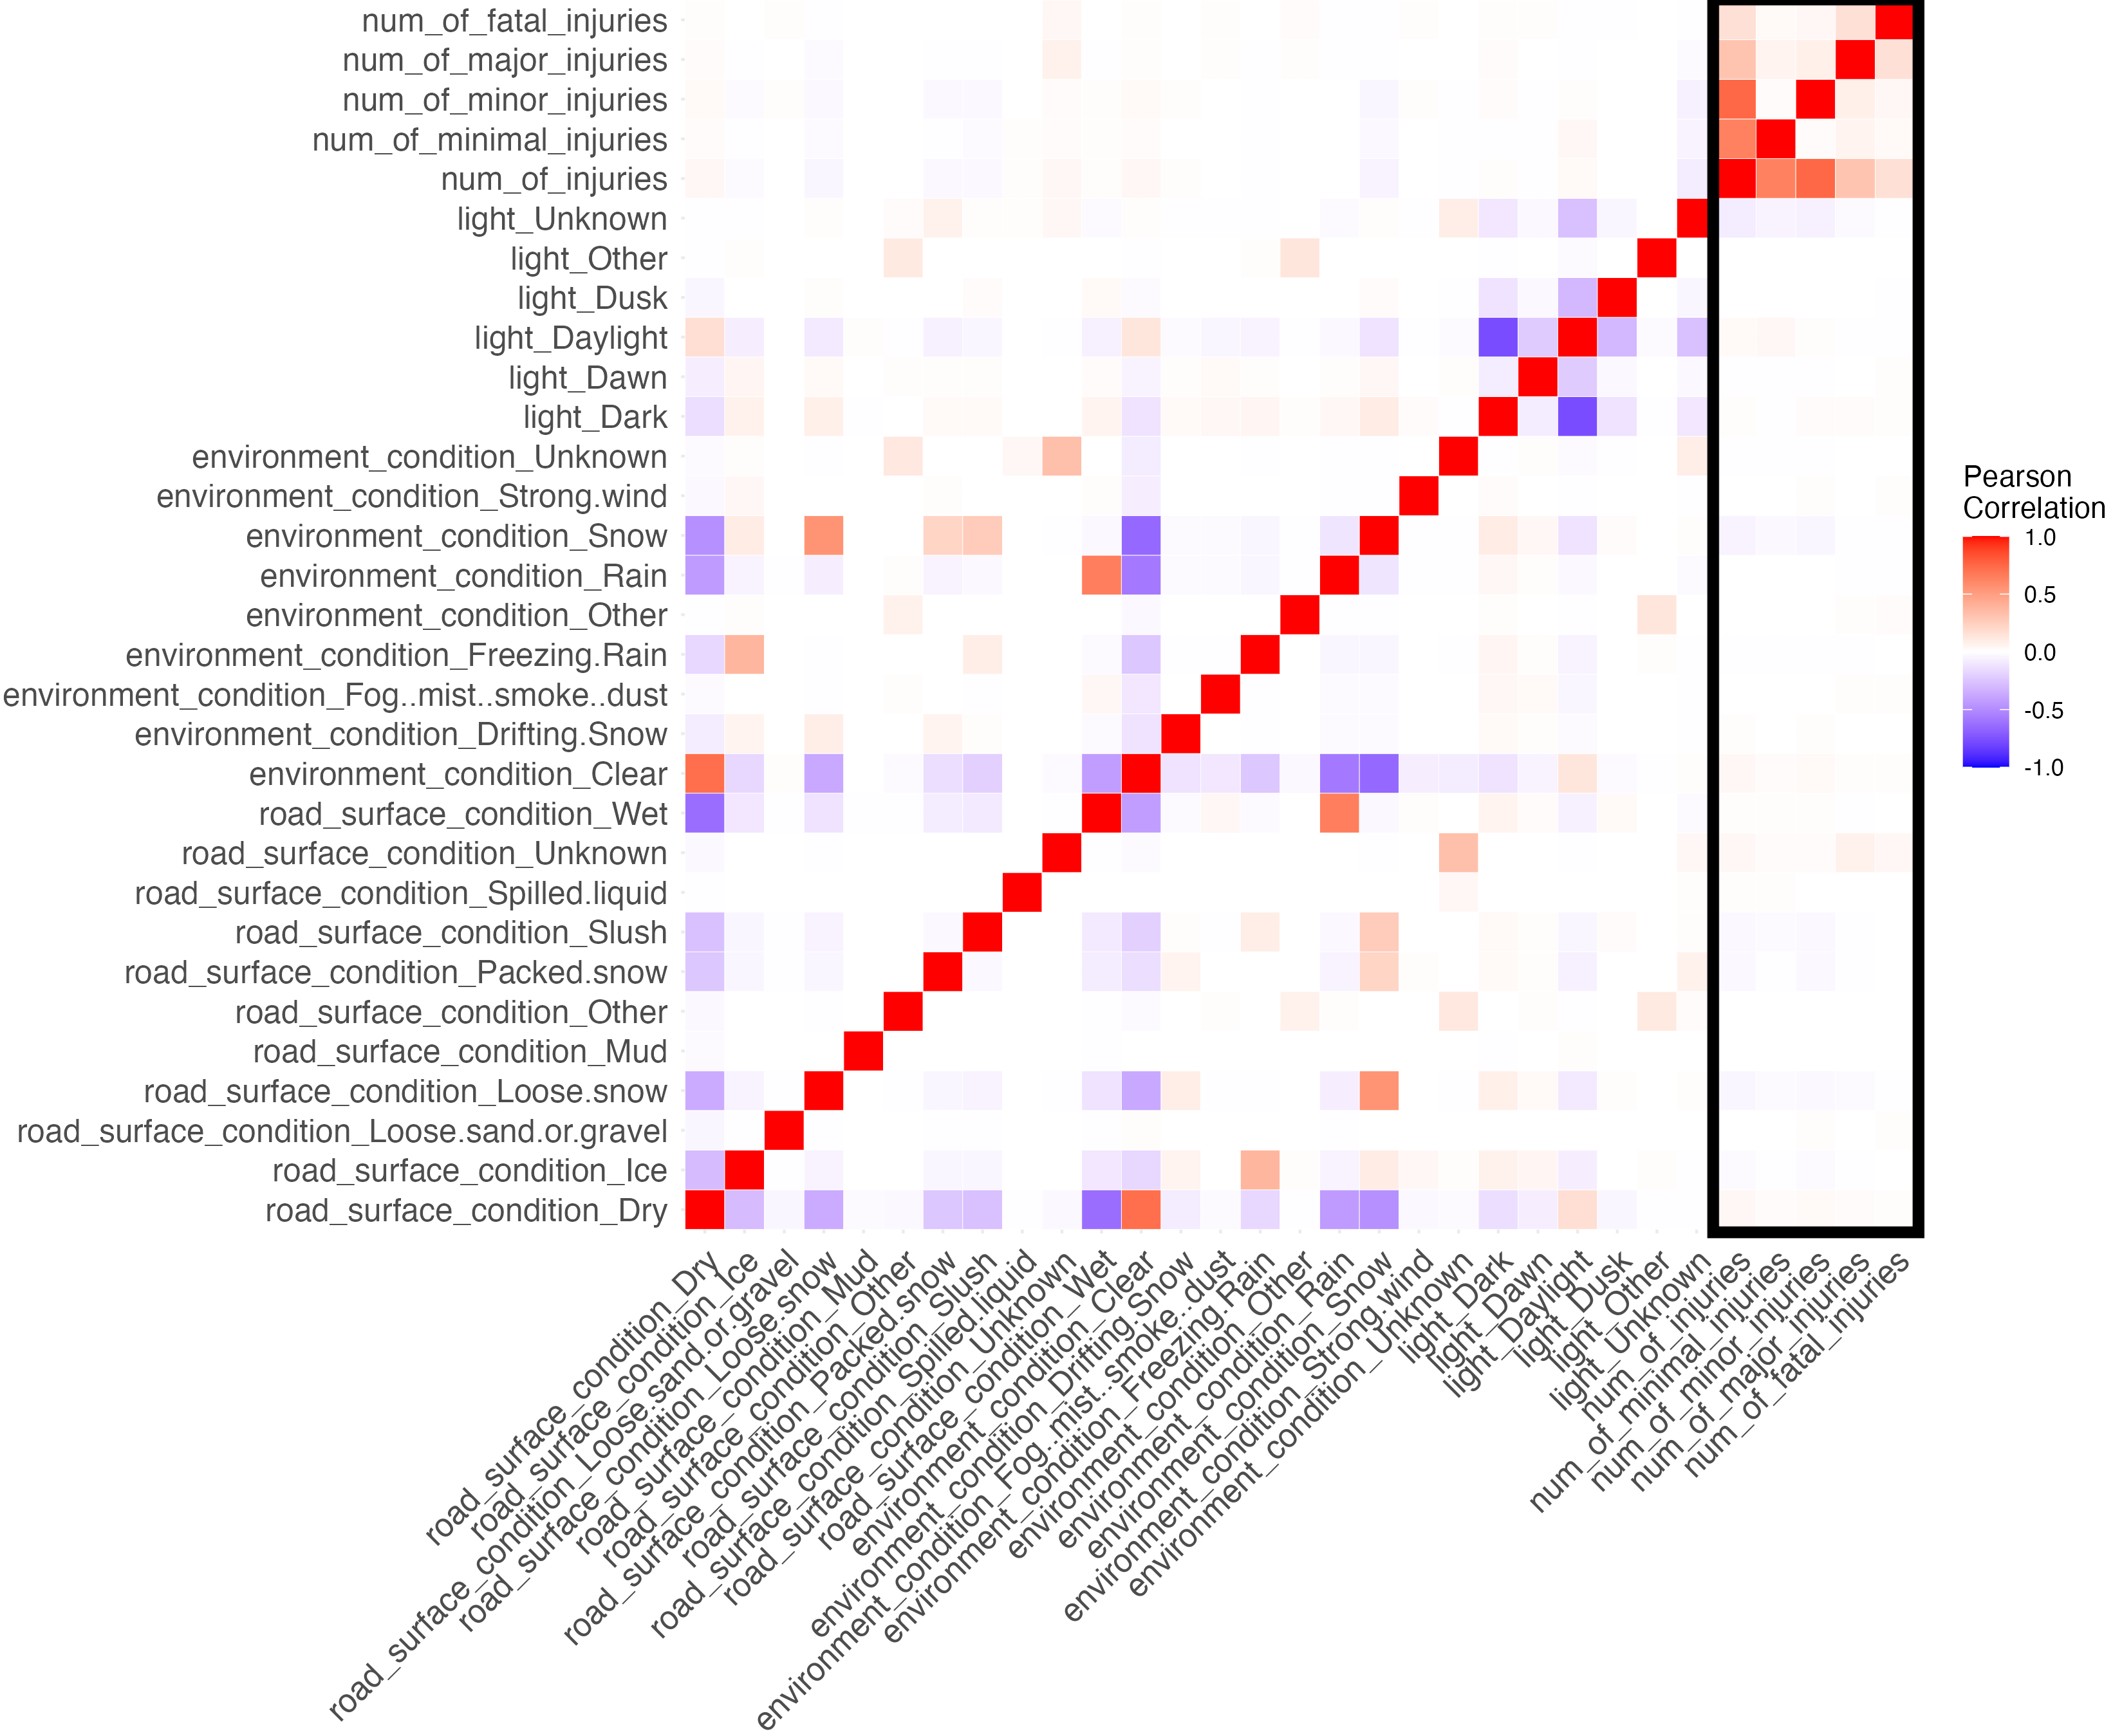
In the above matrix, some of those variables were categorical (initial impact type, road, environment, and light conditions, and traffic control). So we changed them to one hot encoding and got these specific correlation matrices:
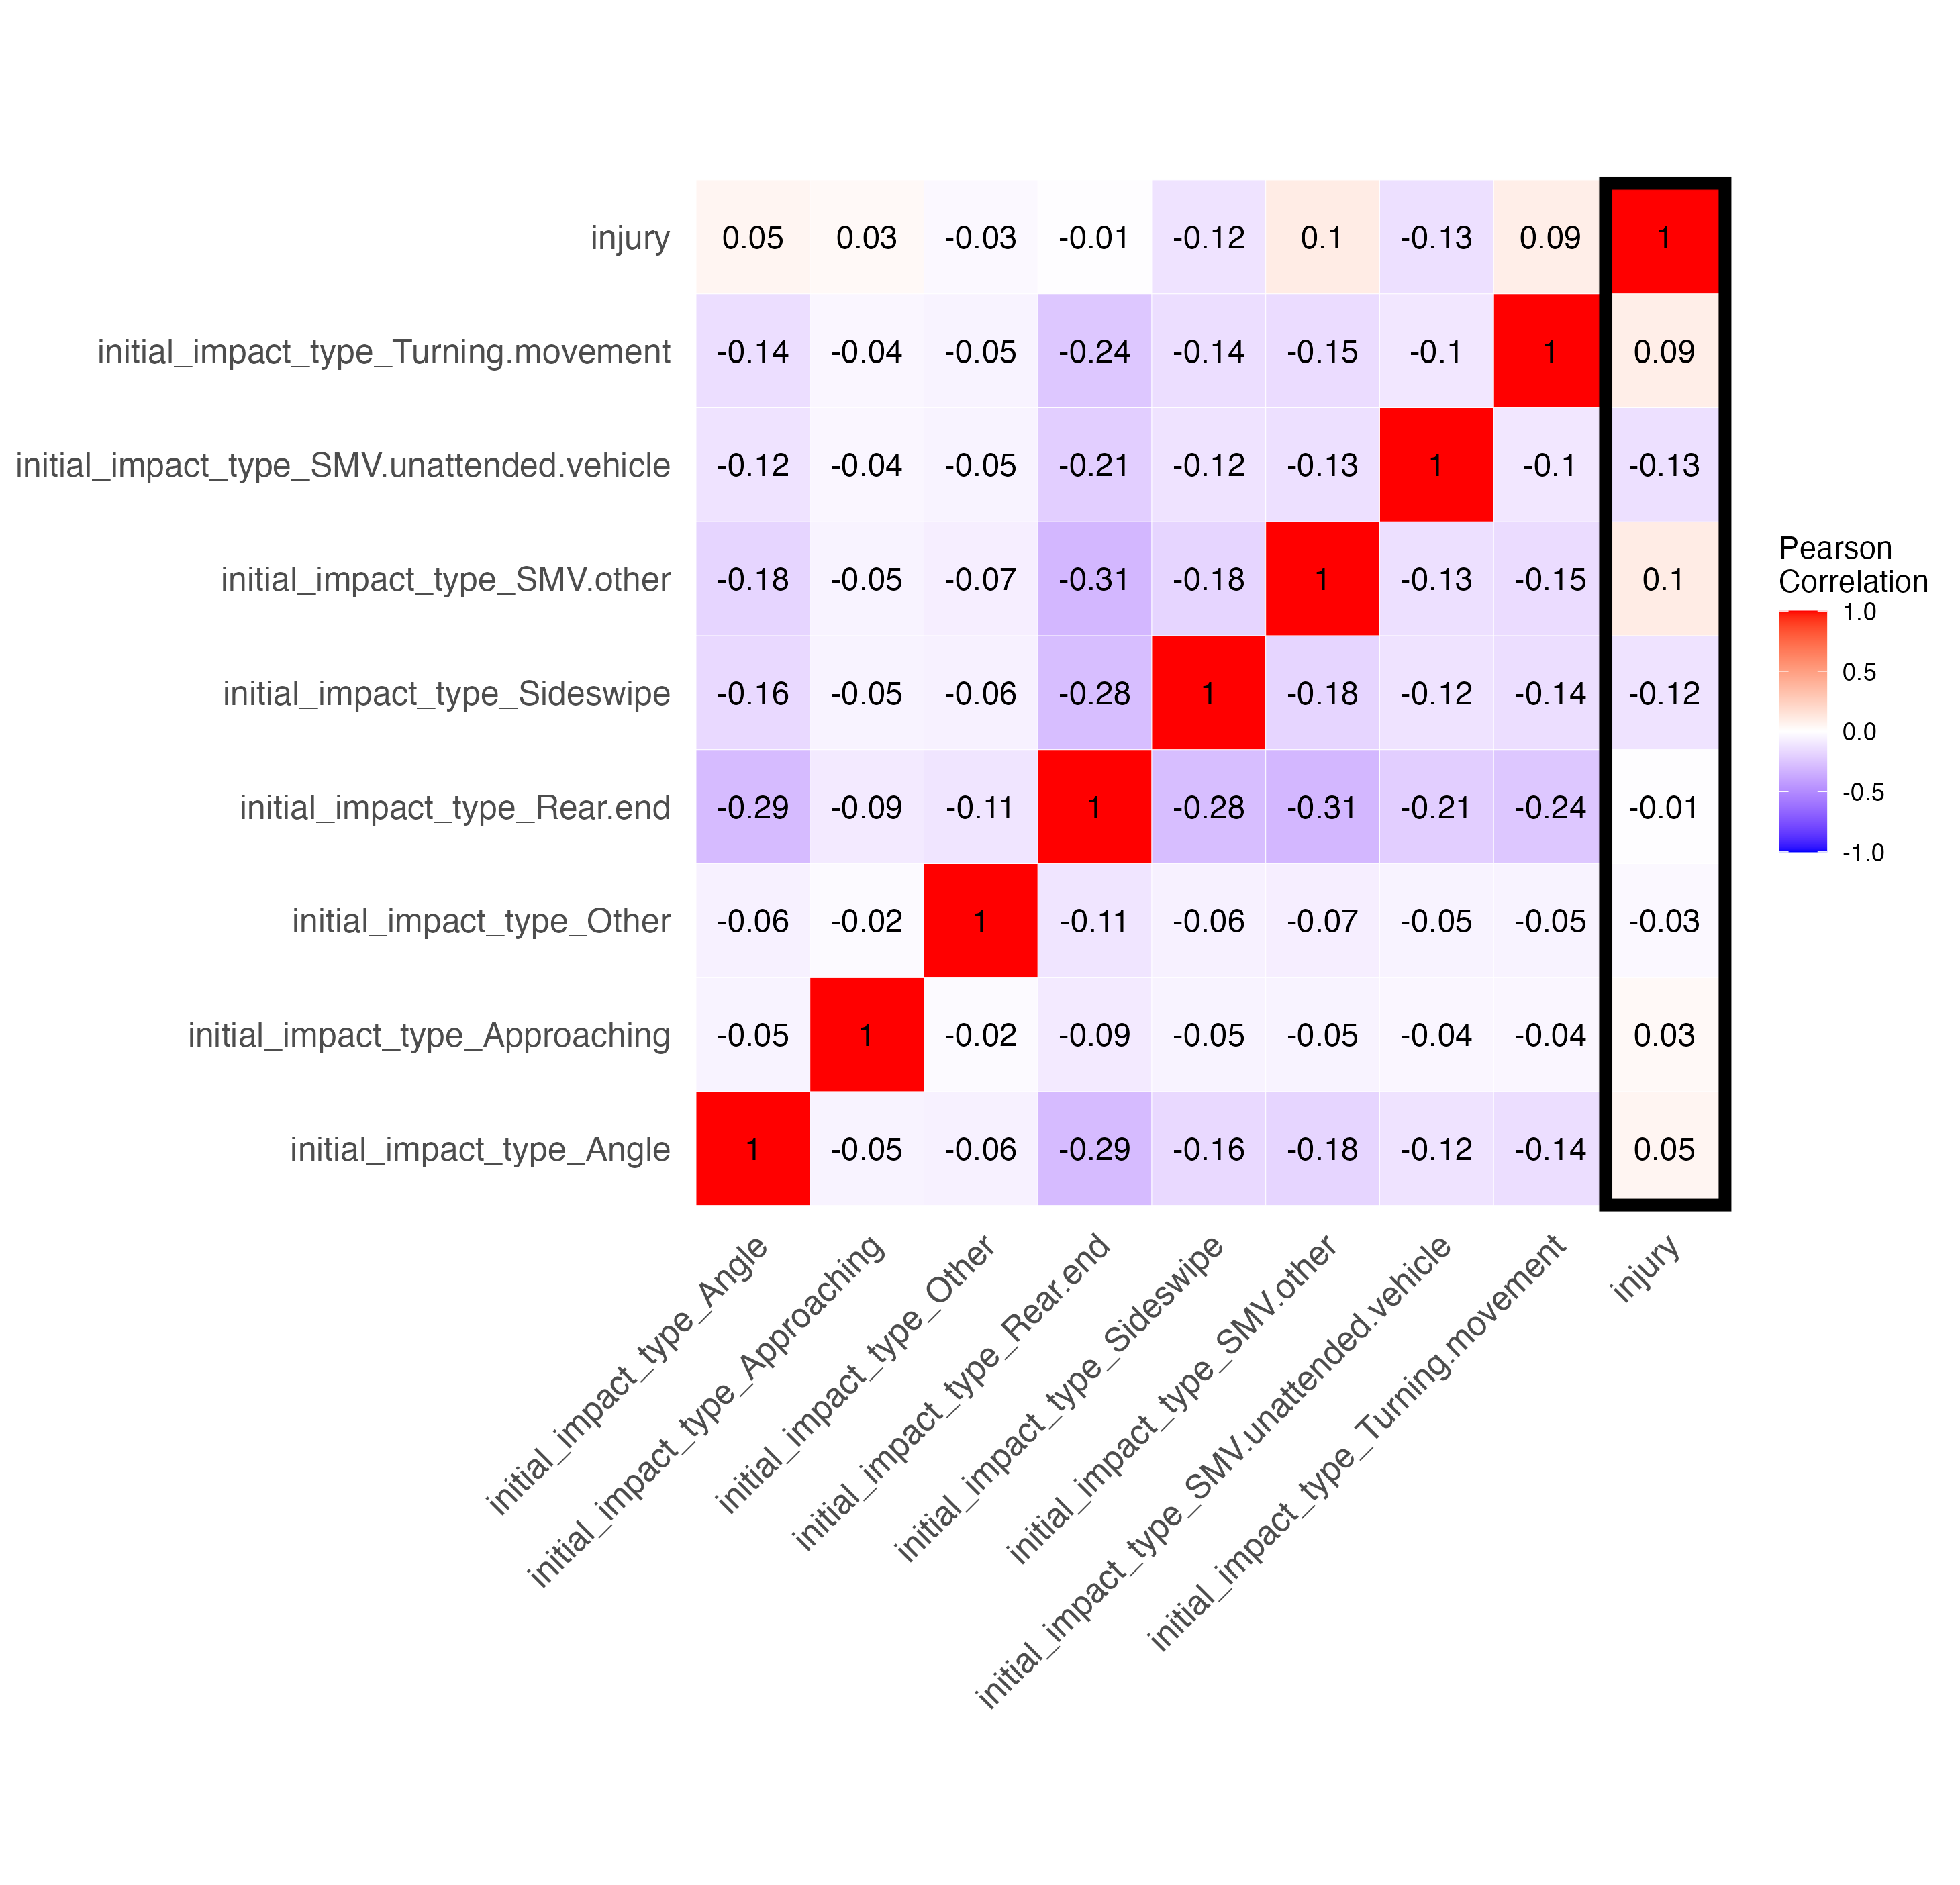
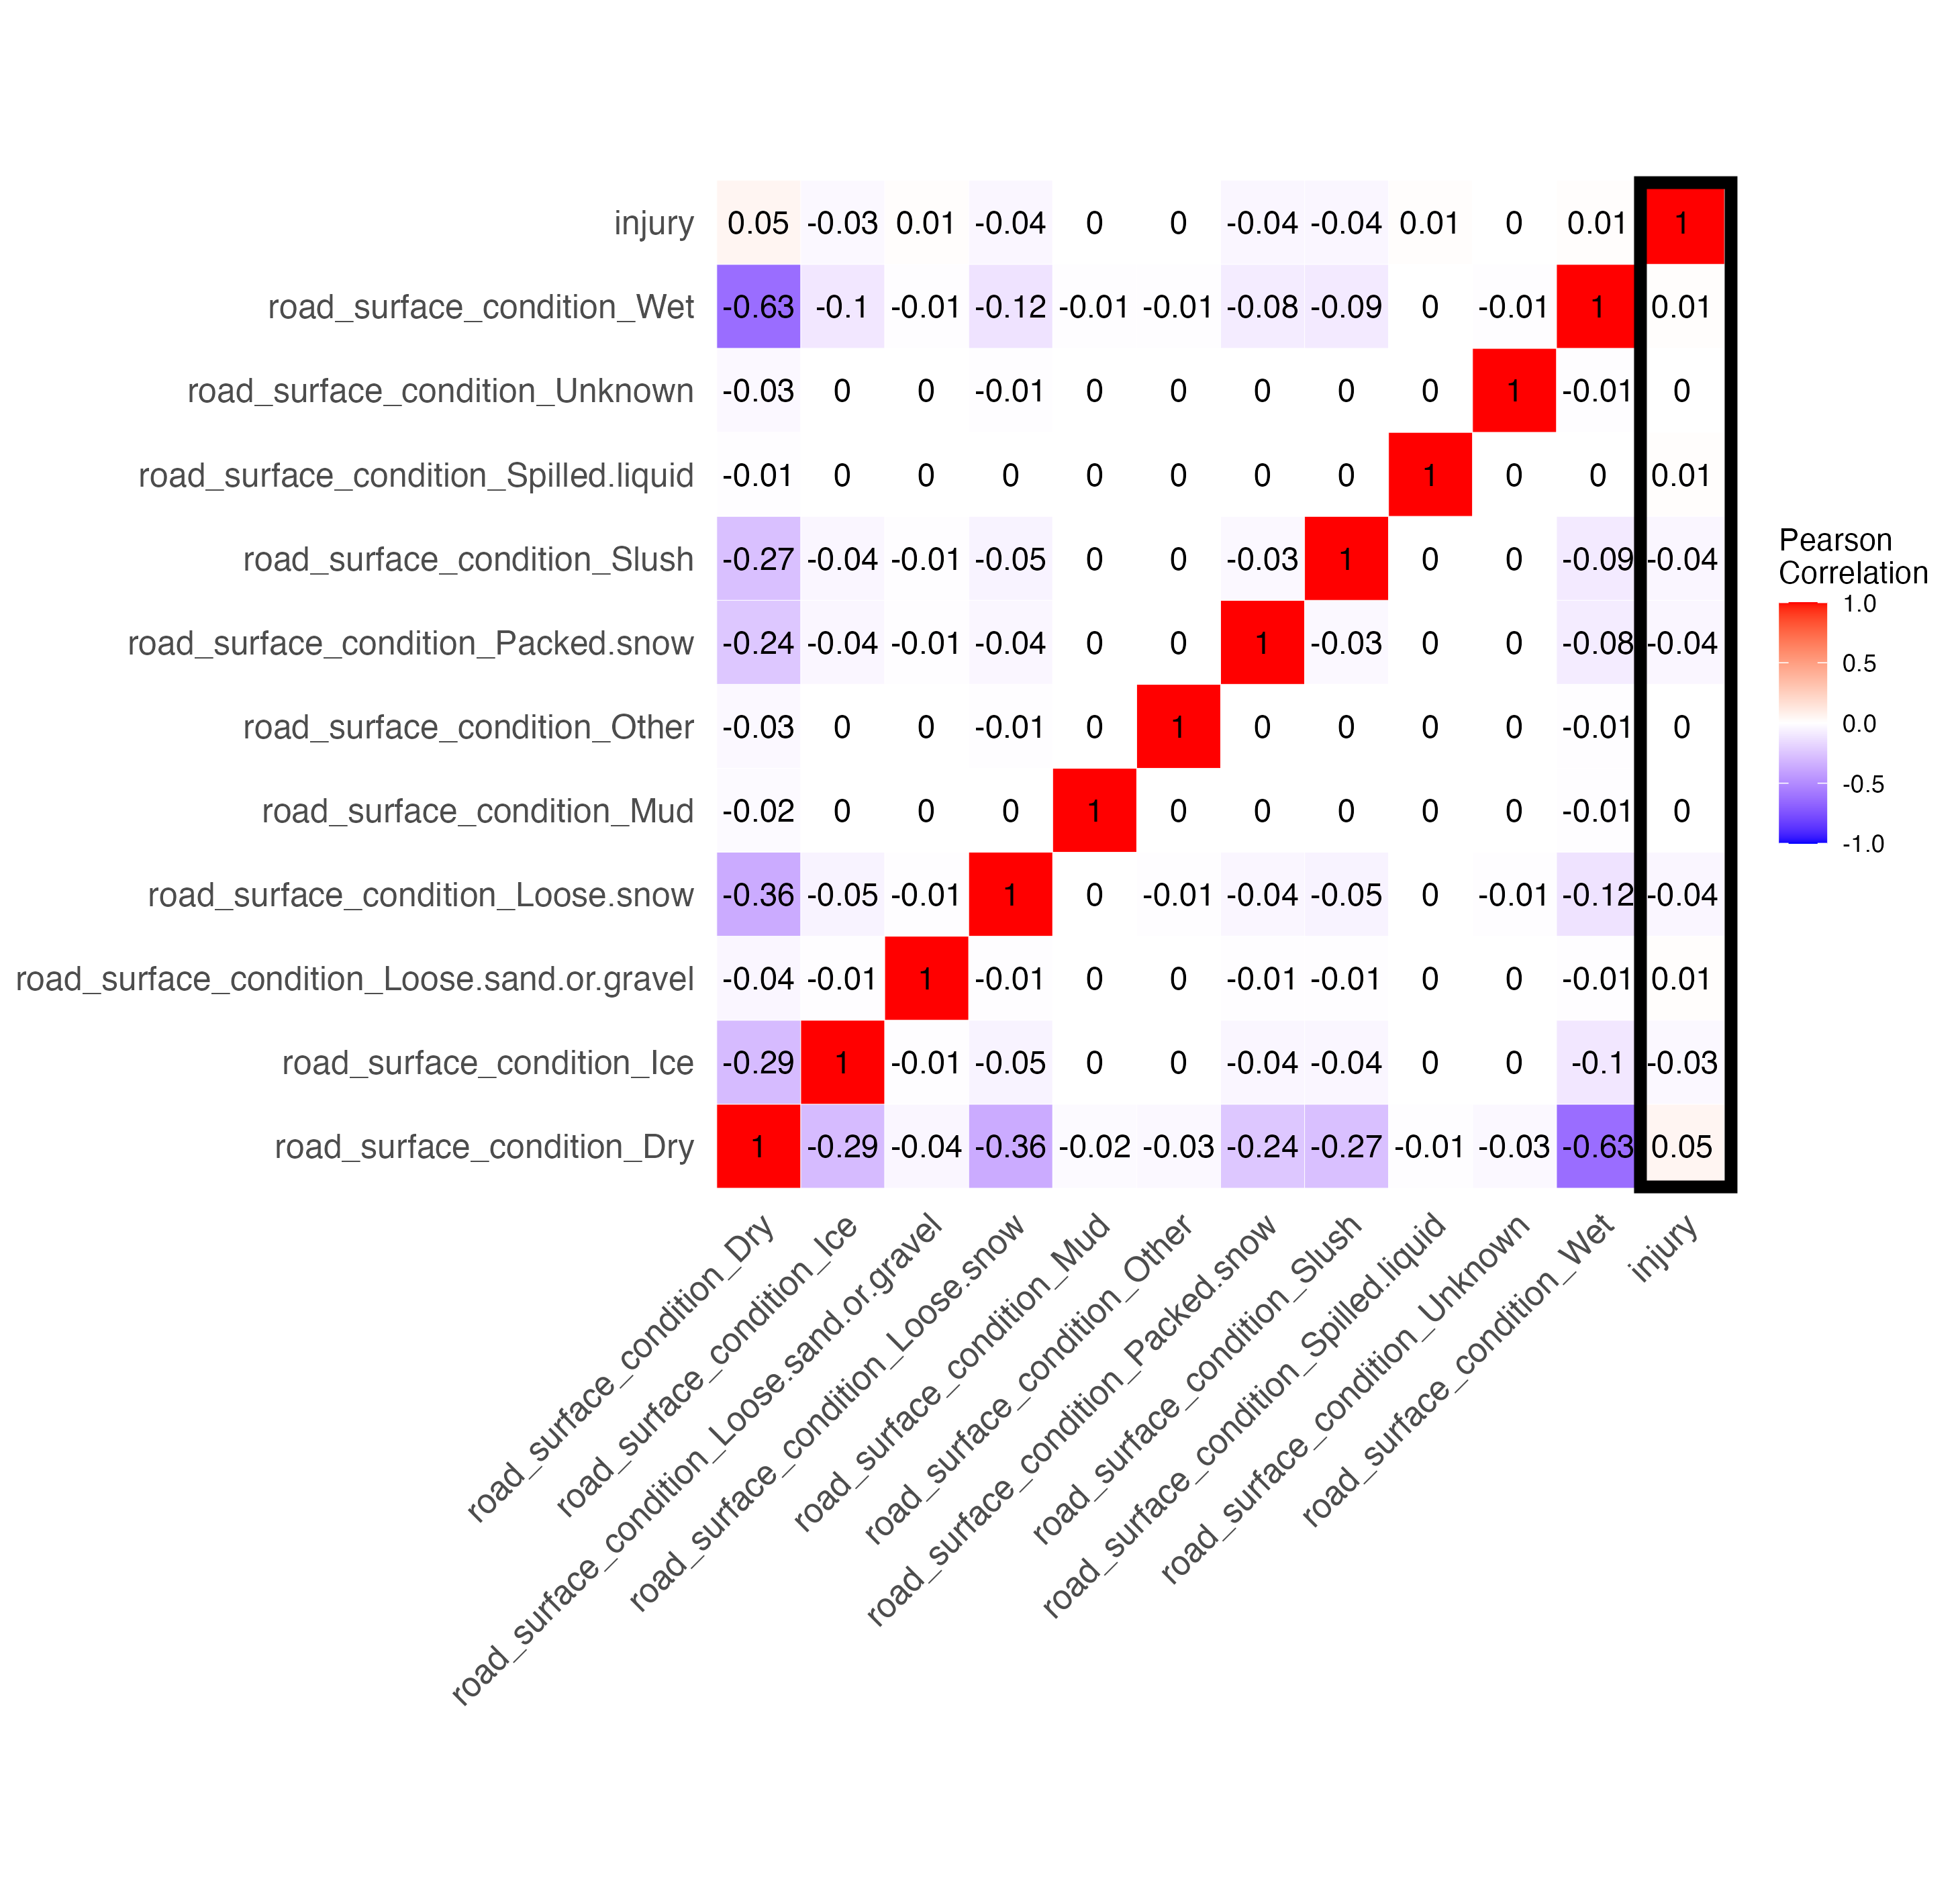
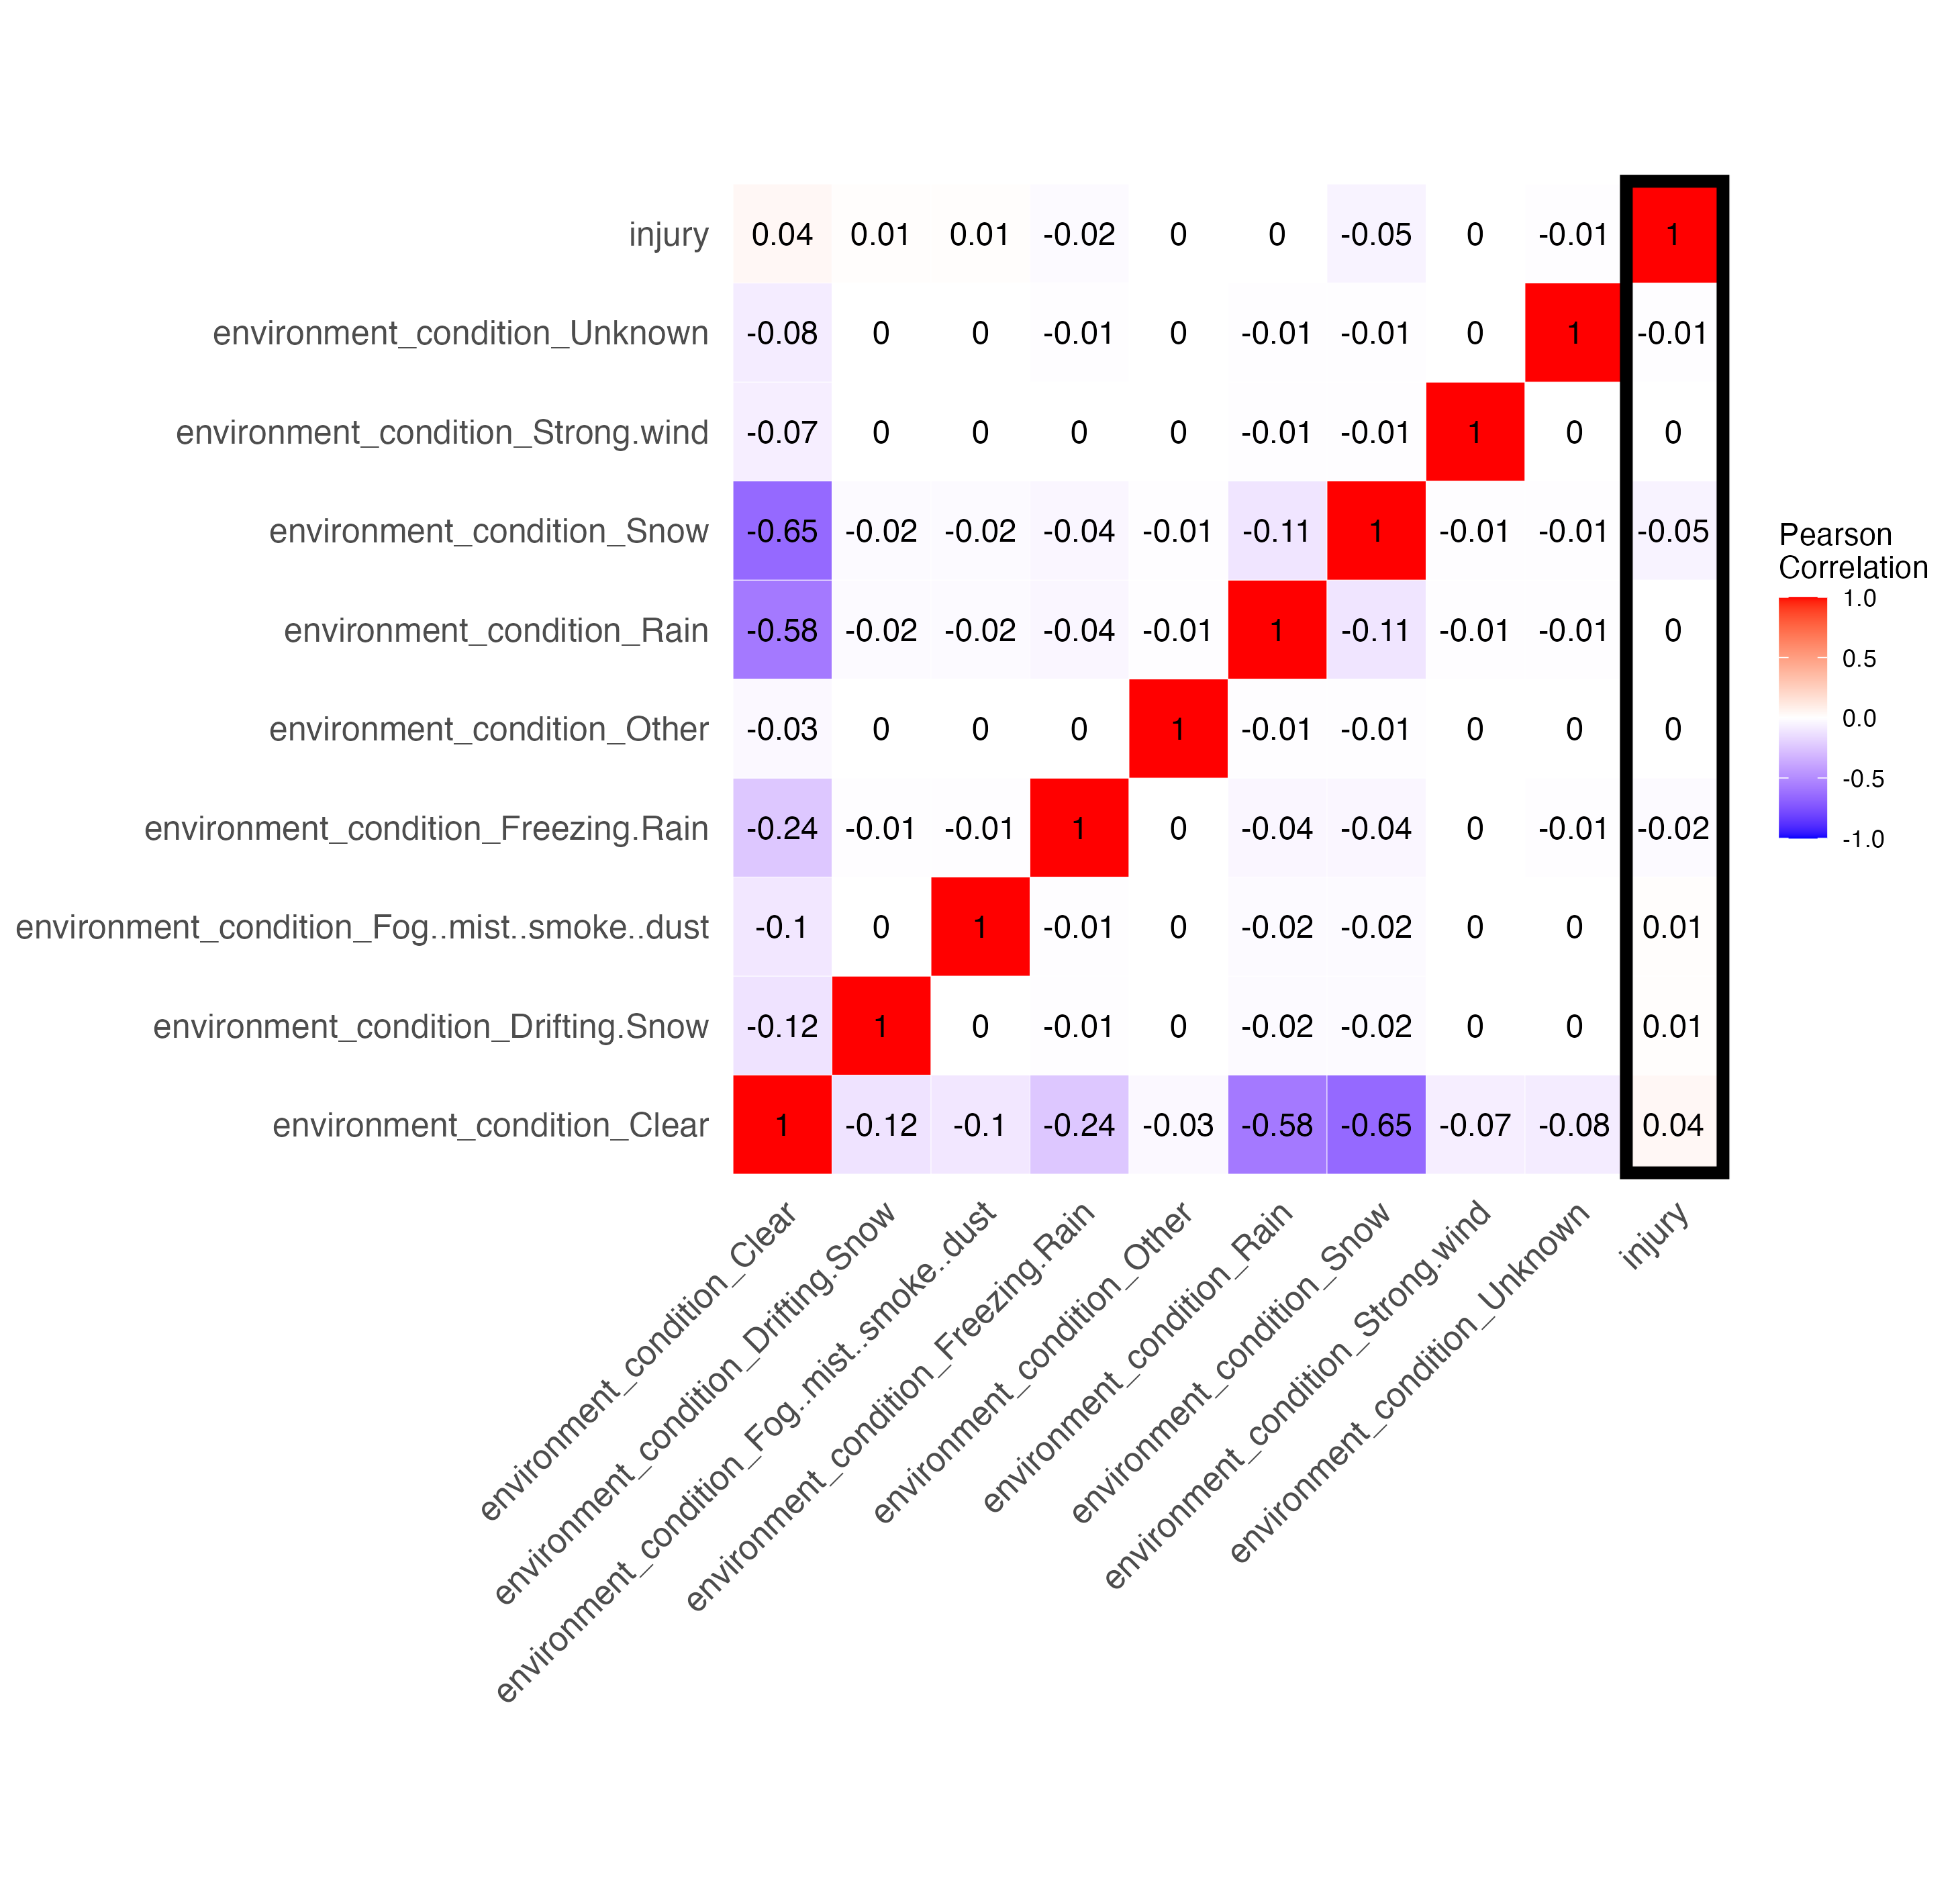
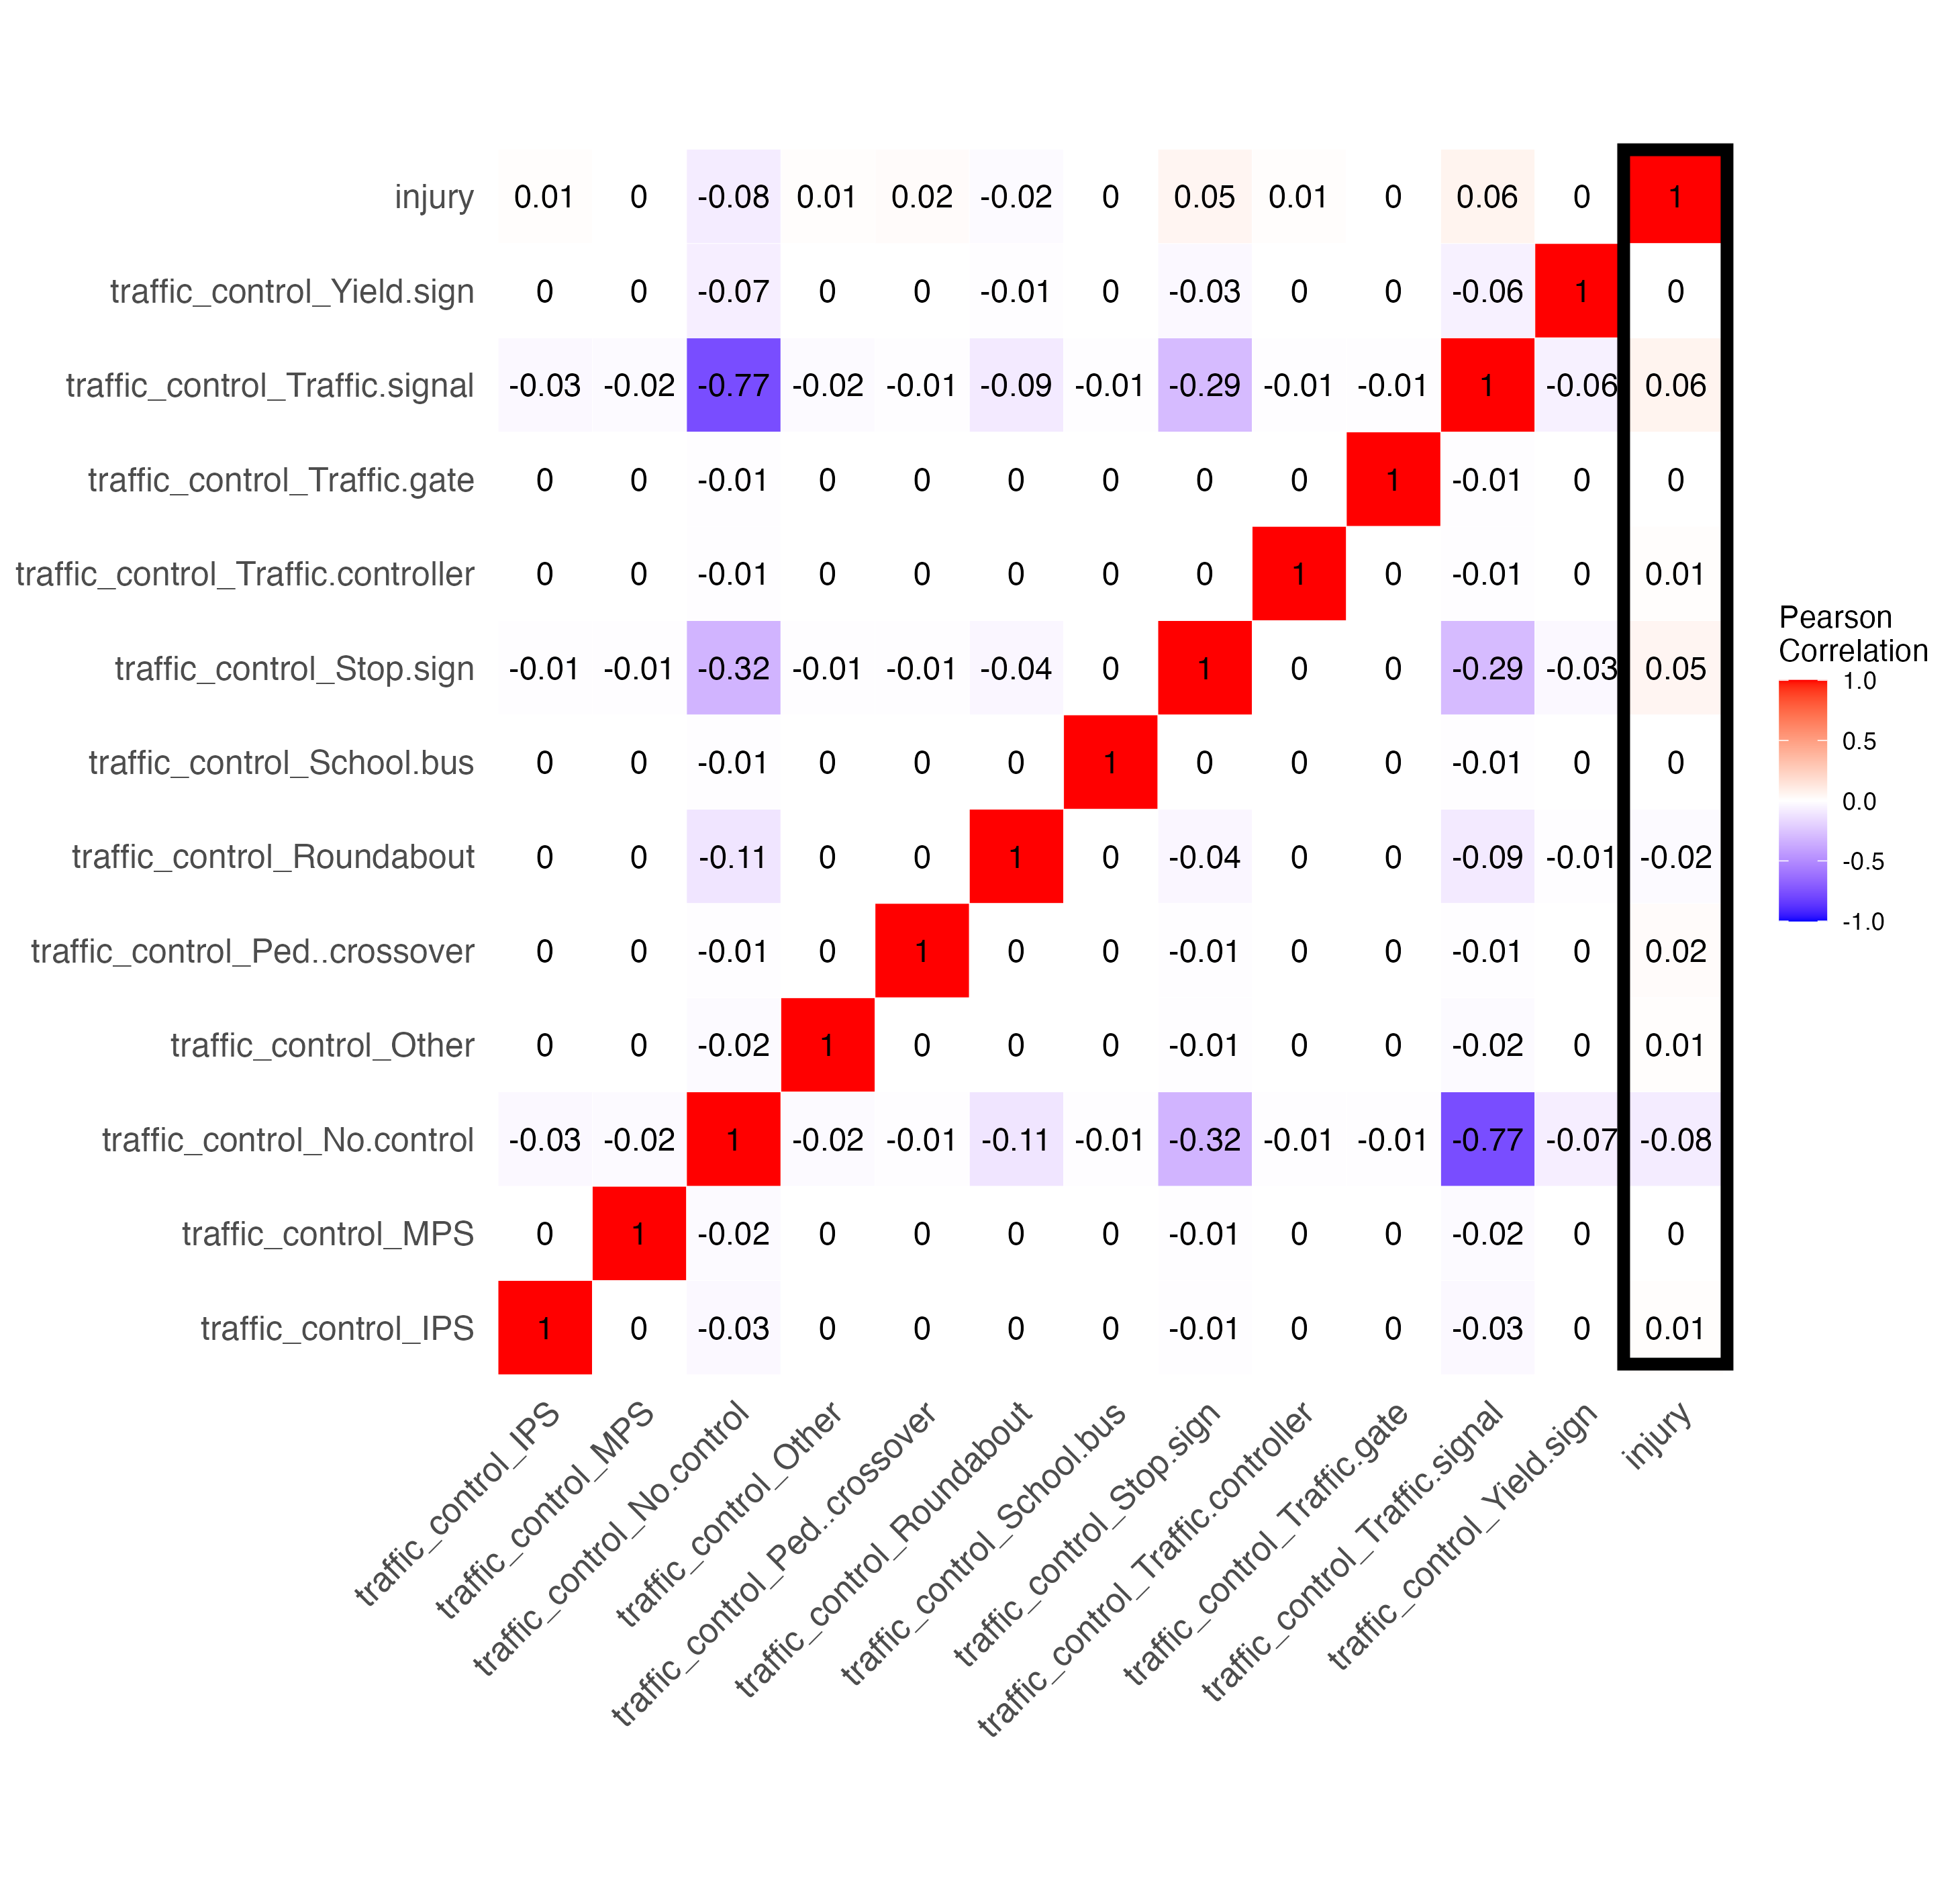
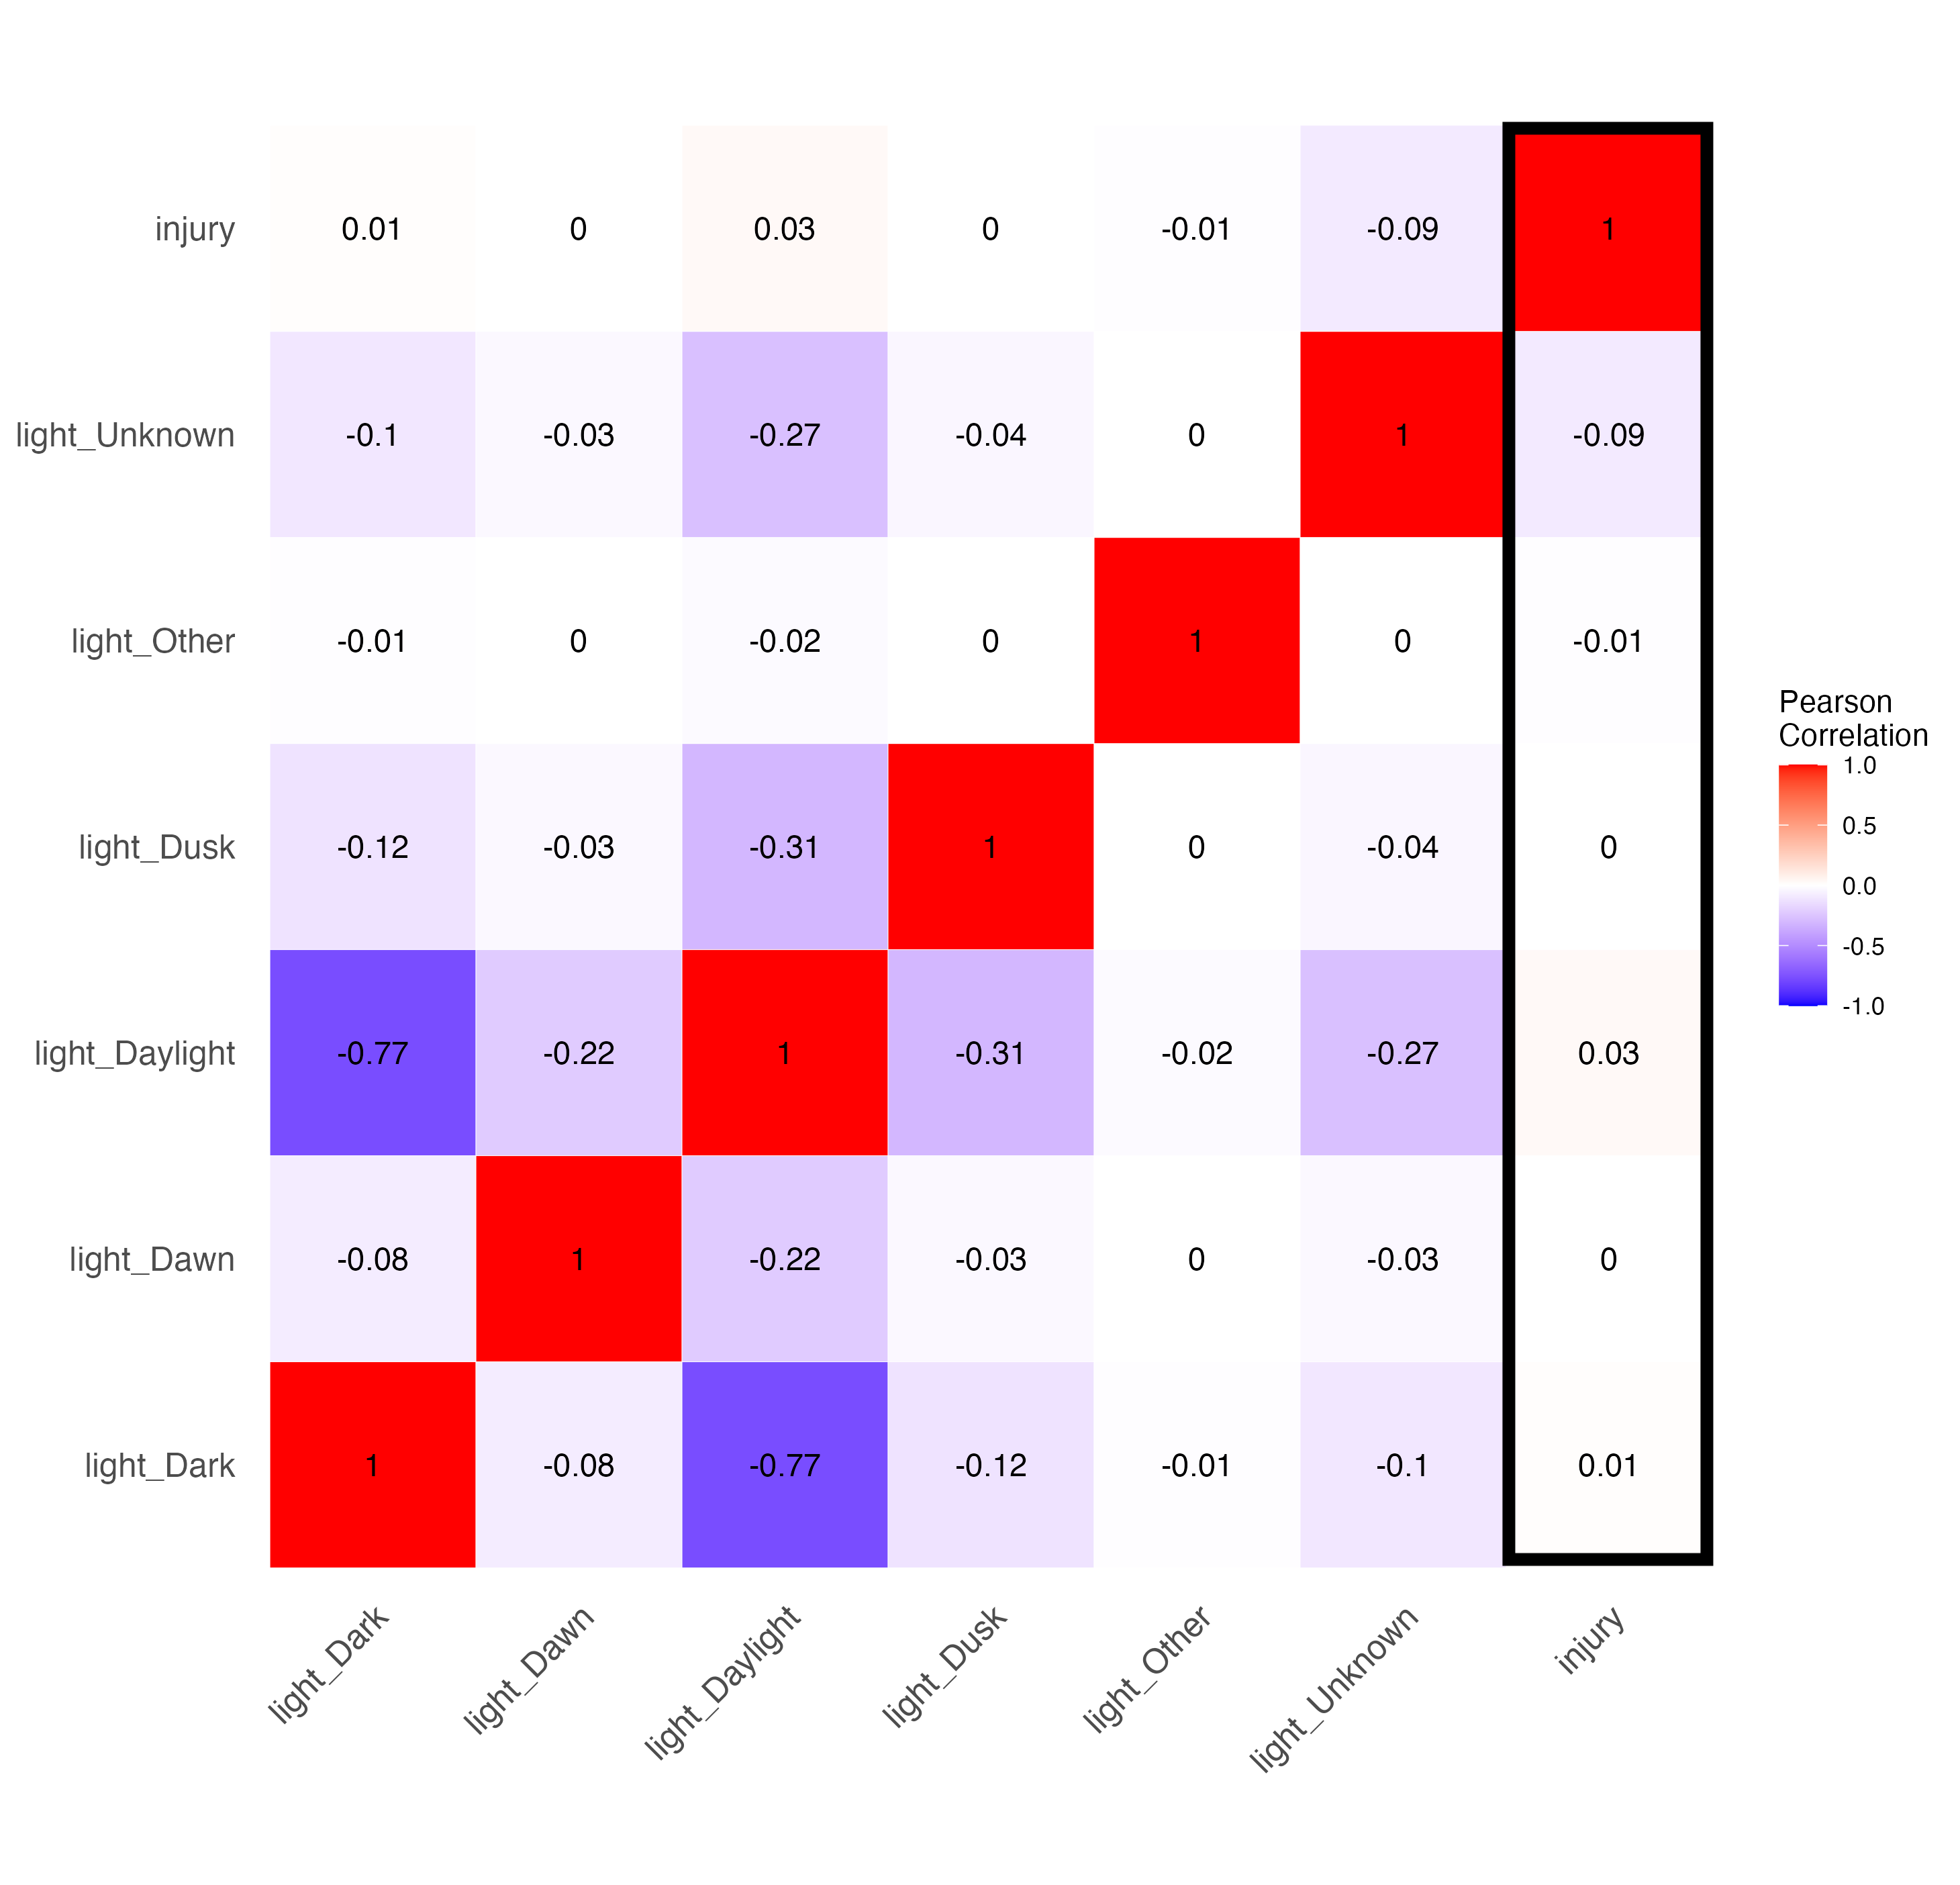
We can see not many features have much of a correlation with injury. Below I breakdown the various features and my hypotheses on why they have the correlation they do.
Most notably, we have a slight negative correlation (meaning that the feature is less likely to result in injury) for the following features:
Most notably, we have a slight positive correlation (meaning that the feature is more likely to result in injury) for the following features:
As can be seen, the answer to the question is, surprisingly, not really.
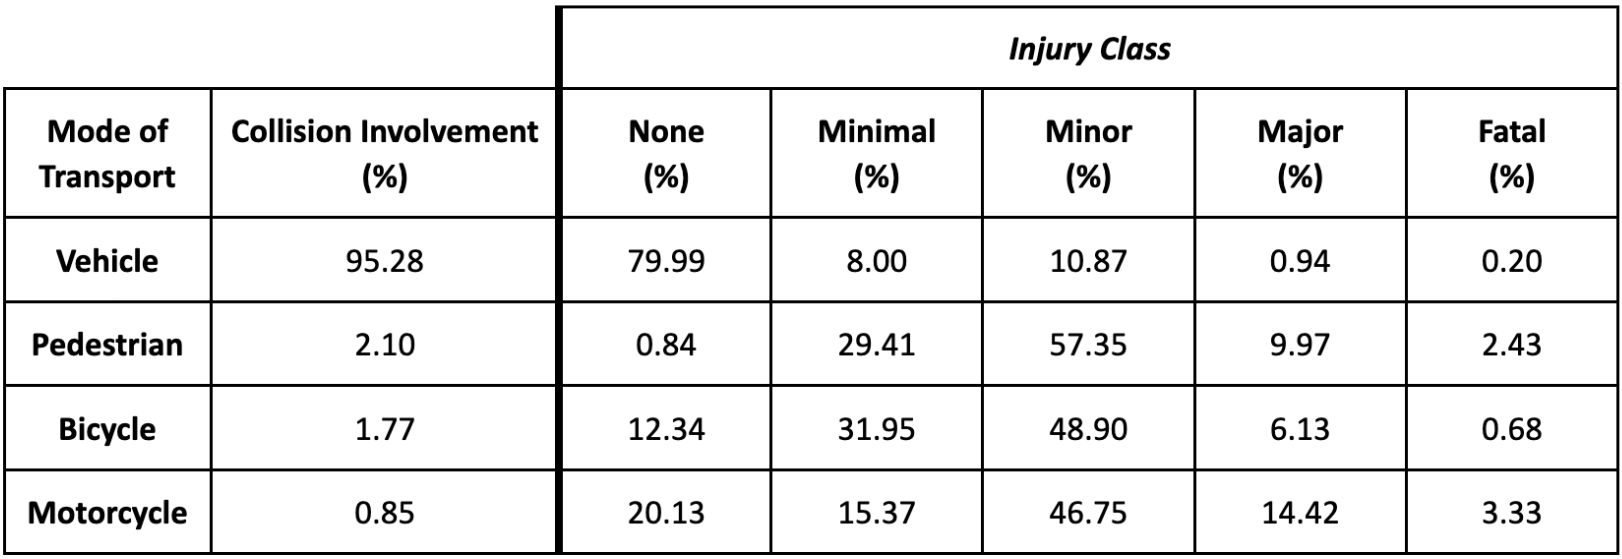
Overall, most collisions involved vehicles (95.28%) and most of these did not involve injury (79.99%). When vehicle injuries did occur, they were usually minimal (8.00%) or minor (10.8%). However, when pedestrians were involved, there was almost always an injury (99.16%); they were often minimal (29.41%) or minor (57.35%). Bicycles and motorcycles were more likely to involve injuries than vehicles. Motorcycles <1% of accidents, but 14% end in major injuries and 3% in fatal. While, pedestrians account for 2% of accidents, with ~2.5% ending in fatal injuries with 57% in minor injuries
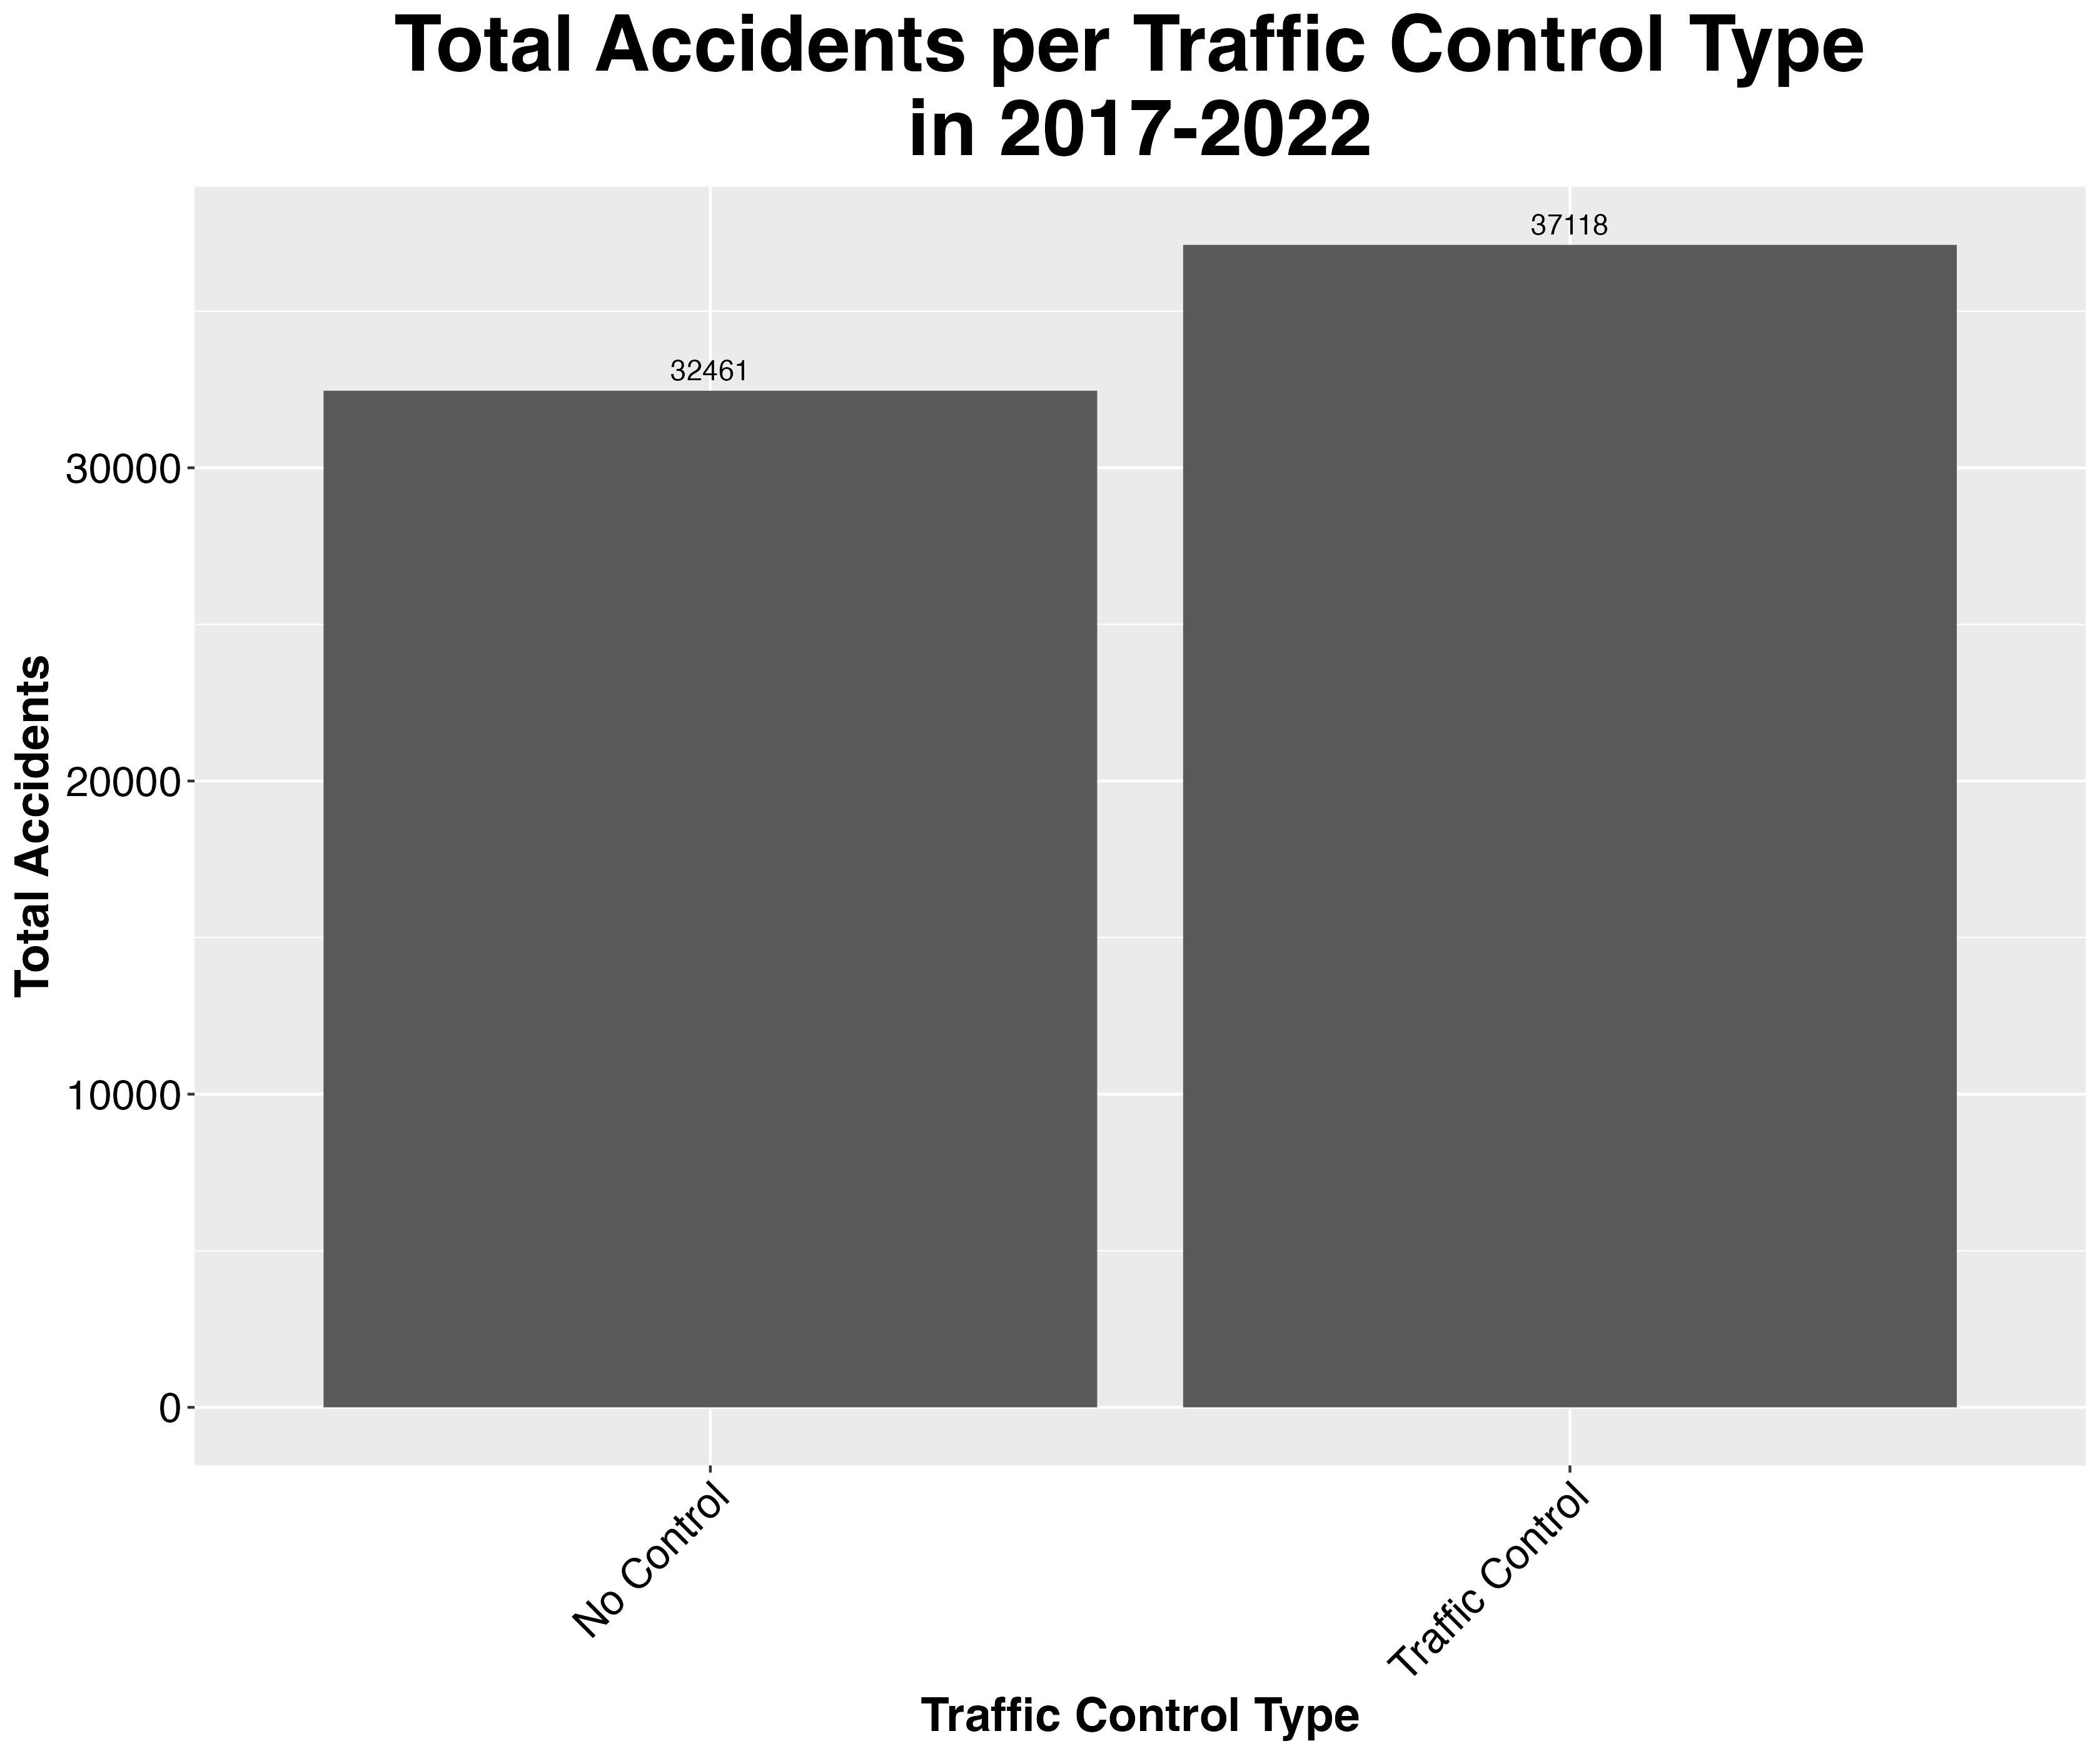
All traffic controls together account for a higher number of accidents. However, it is important to note that we saw in our correlation matrix that traffic controls tend to correlate with intersections. Intersections in general tend to be more dangerous as there are many directions of traffic flow, leading to a higher chance of an accident occuring. This means that although our data shows traffic controls coincide with higher number of accidents, this is a perfect case of not assuming causality, but rather maybe are confounded.
The first model that was analysed was the k-Nearest Neighbours (k-NN), coded using the SciKit-Learn library. Due to the class imbalance, several sampling methods were tried to increase performance: Random OverSampling and SMOTE. These were done using the imblearn.over_sampling library. The final model selected was using six nearest neighbours from hyperparameter tuning. The second main model that was analysed was the Decision Tree, also coded using the SciKit-Learn library. In order to account for class imbalance, Random OverSampling was tried on a set of iterations of the model, using the imblearn.over_sampling library, and also setting class weights to be balanced to penalise the underrepresented class. Also to help with instability of Decision Trees, the Random Forest bagging technique was tried.
Finally, PyCaret was used to compare performance of different models. The different models compared were: Ridge Classifier, Linear Discriminant Analysis, Logistic Regression, Gradient Boosting Classifier, Ada Boost Classifier, Random Forest Classifier, Extra Trees Classifier, K-Neighbors Classifier, Decision Tree Classifier, SVM - linear kernel, Naive Bayes, and Quadratic Discriminant Analysis. On top of those, there was also a dummy classifier to give a baseline. Here are the performance metrics for each one (highlighted is the best performance in the column):
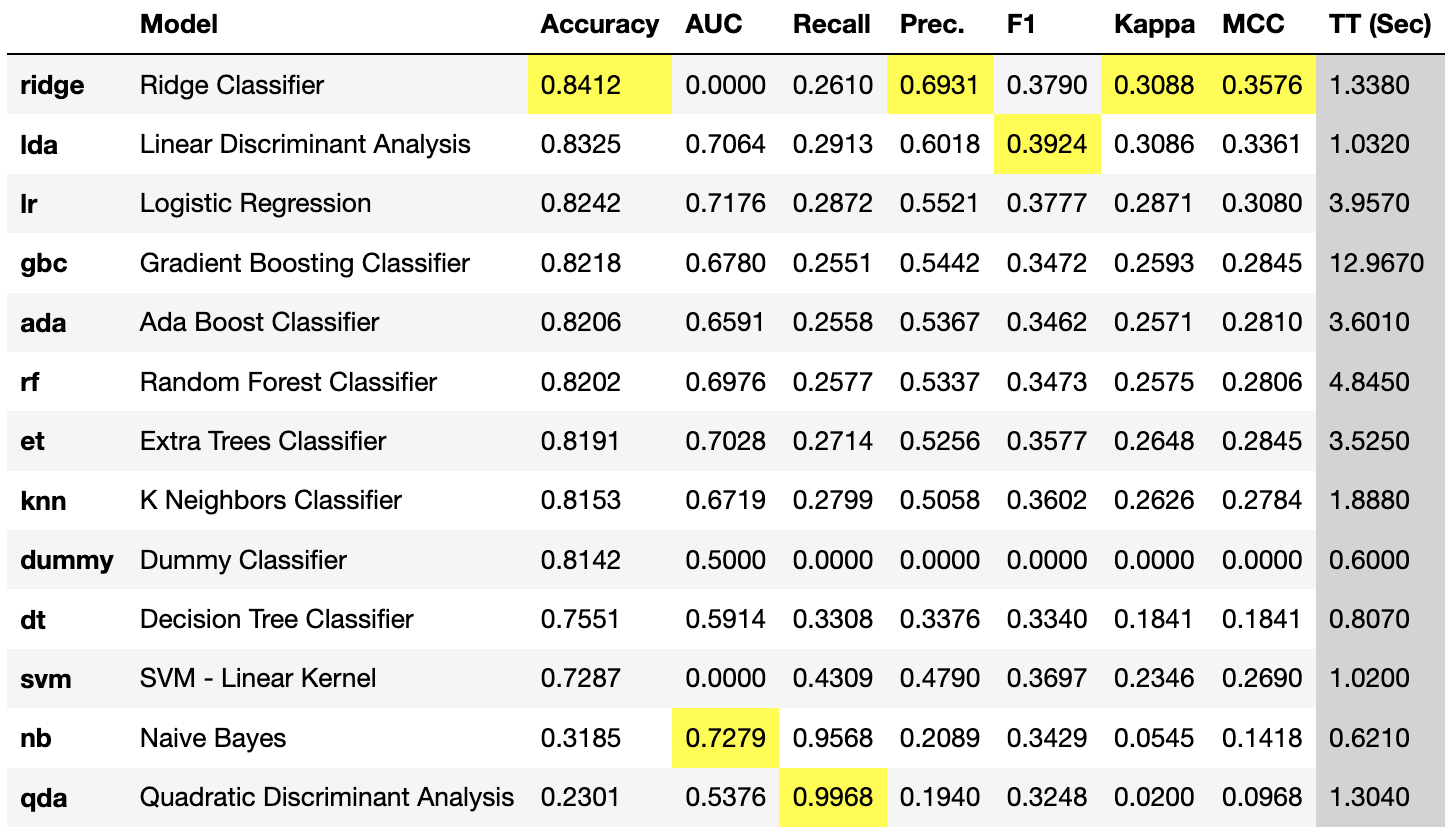
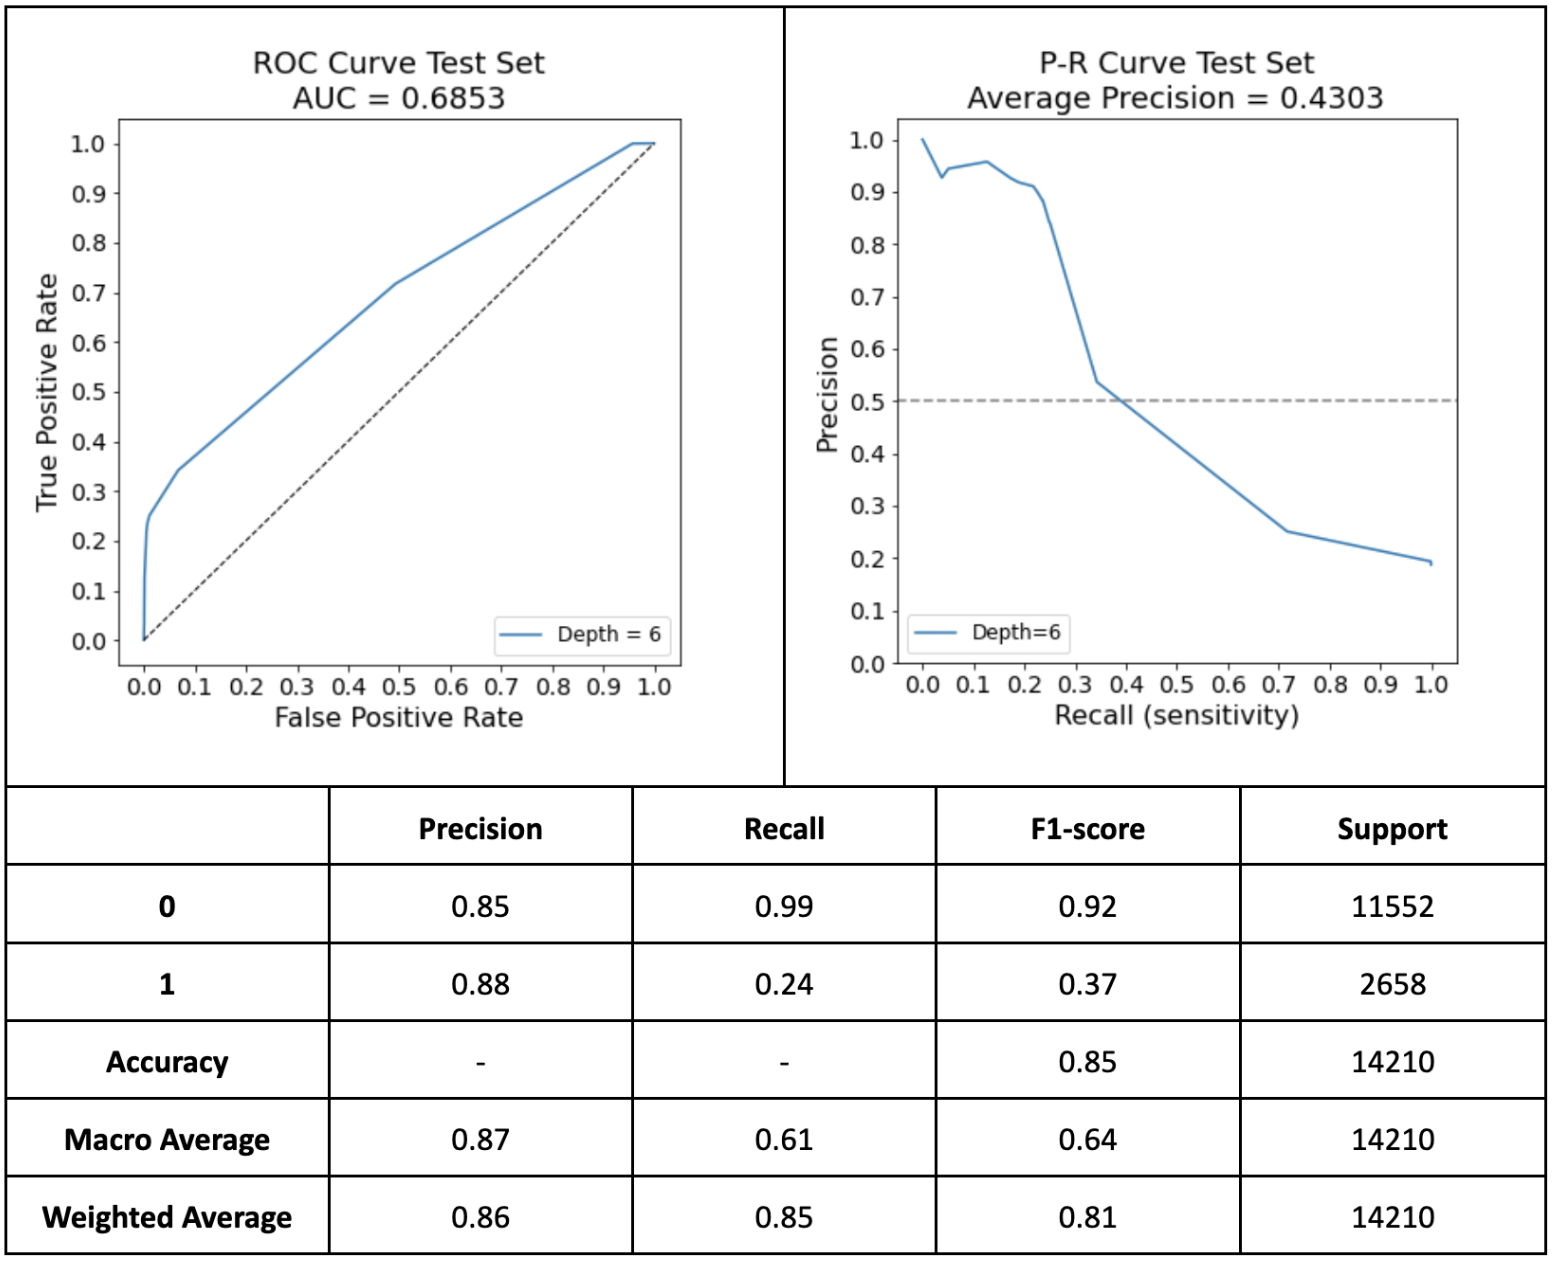
The final model selected due to superior performance was the decision tree with entropy criterion, and a maximum depth of 6.