
Thank you for visiting my website!
At the time of writing this (2021-12-30), the City of Ottawa has 61 redlight cameras. Their data from 2016-2020 of red light camera violations is available on their website. Some of the locations have had cameras installed after 2016, so they do not have data in the given years prior to the installation. Therefore, the total number of locations with data entries is 281. With this dataset, I thought it would be worthwhile to analyze the data looking from the lens of when and which cameras are worth maintaining from a financial point of view.
There are costs to consider for each red camera installation, mainly breaking down into (a) start-up costs (engineering, equipment purchase, installation, etc.) and (b) operating costs (staffing, maintenance, etc.). Based on my online research, Ottawa has claimed that each camera costs approximately $35,000. The City of Ottawa did not specify whether $35,000 per year per camera is for just the cameras themselves or including the maintenance/operating costs or whether the company gets any percentage of tickets. So more research was done and Kingston provided data that it costs around $53,000 per camera just for the operation of the red light camera system, not counting staffing costs. Sometimes, red light camera companies will lower the price of the cameras in exchange for a part of the ticket revenues the city gets back. Each ticket is $325: $60 goes to Ontario and the City of Ottawa gets $260 and $5 goes to the courts.
So for the sake of this project, I will be basing my assumptions of the total cost to be $53,000 per year per camera, with the revenue being 260$ per ticket issued.
The main question I imagine the City of Ottawa would want to know is how to maximize their profit while decreasing aggressive driving behaviour using strategically placed red-light cameras.
This problem will be broken down into three main sub-sections, which focus on different aspects of the main problem:
Question 1) Which month(s) see the most number of violations?
Question 2) Which location(s) have the most violations (2016-2020)? 2021 update
Question 3) Which locations, if any, had a statistically significant change in the redlight camera violation occurrences for the year 2020? 2021 update
For the questions, it is important to analyze the current data available (2020) to see patterns due to regular changes that would occur year-over-year but also major changes that would have occurred during the pandemic (beginning mid March 2020 in Ottawa). It is also useful to analyze previous yearly data because it provides us with a larger picture of patterns that might occur through the years.
Based on the costs, we would want to analyze what the breakeven point is to make the cameras worth maintaining.
Assuming a cost of $53,000 per camera per year with revenue of $260, we get 204 violations:
$53,000 divided by $260/violation = 203.8 ~ 204 violations
This would mean that we would expect each camera to get 204 violations each year in order to breakeven for the cost it takes to run it each year.
We want to analyze this, to know which months we should ensure that we allocate more funding for those months to keep up with maintenance that may occur.
The summer months will show a higher number of violations, as I speculate that more people tend to be out during the summer months. A bigger population of drivers will draw a bigger set of redlight violations.
204 violations divided by 12 month would be 17 violations on average per month per camera.
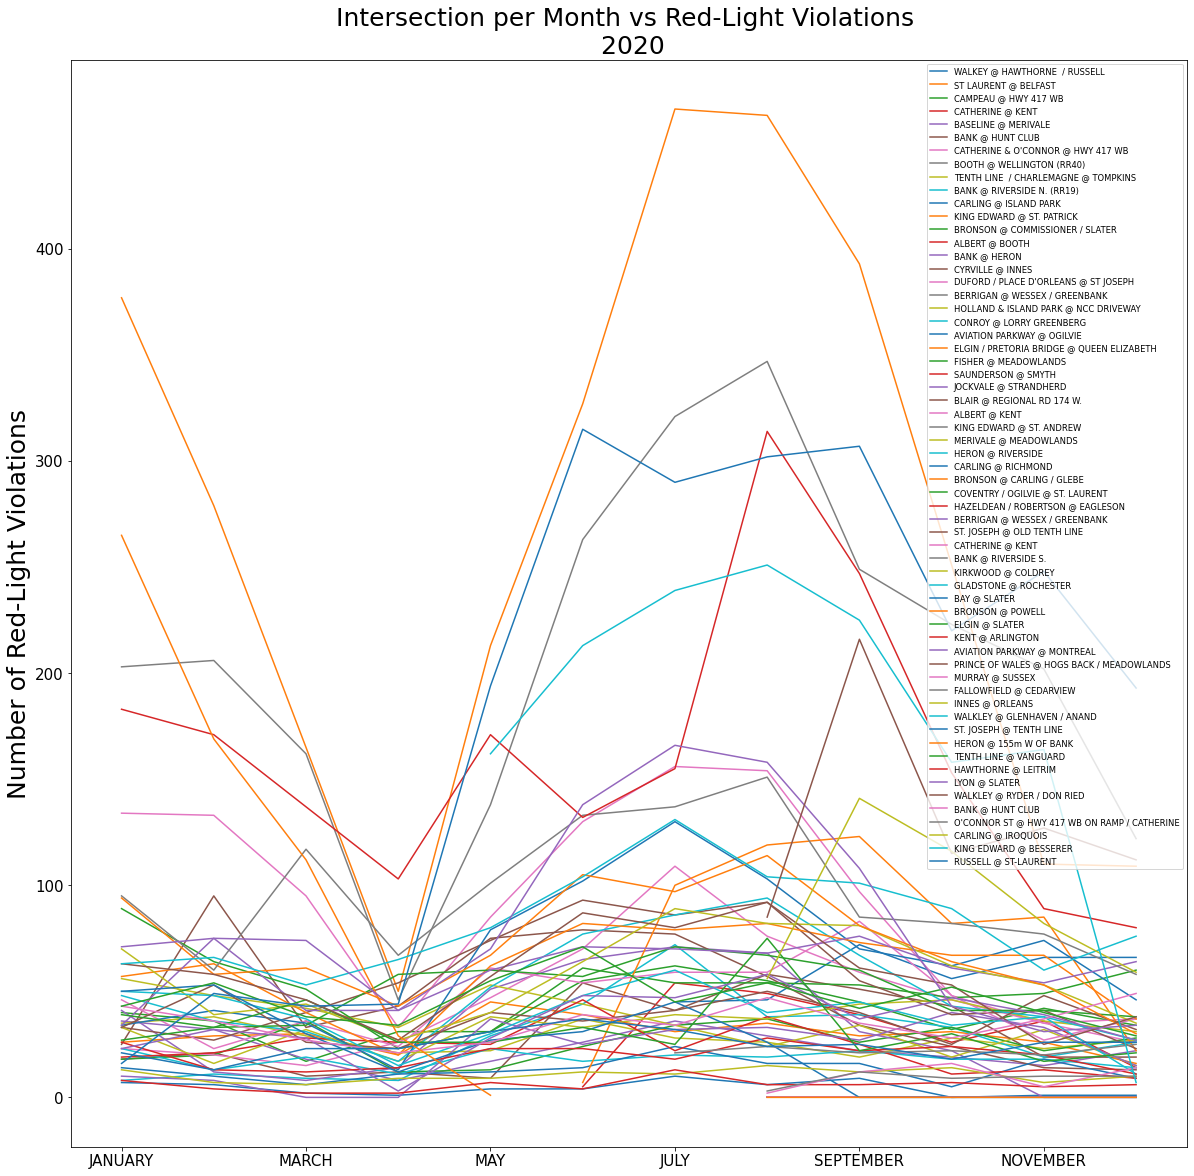
Findings for 2020 - excluding null values from the data set
In this data set there are 61 cameras, meaning, we would expect 1037 (61 cameras * 17 violations) total violations per month and 17 violations on average per month to breakeven.
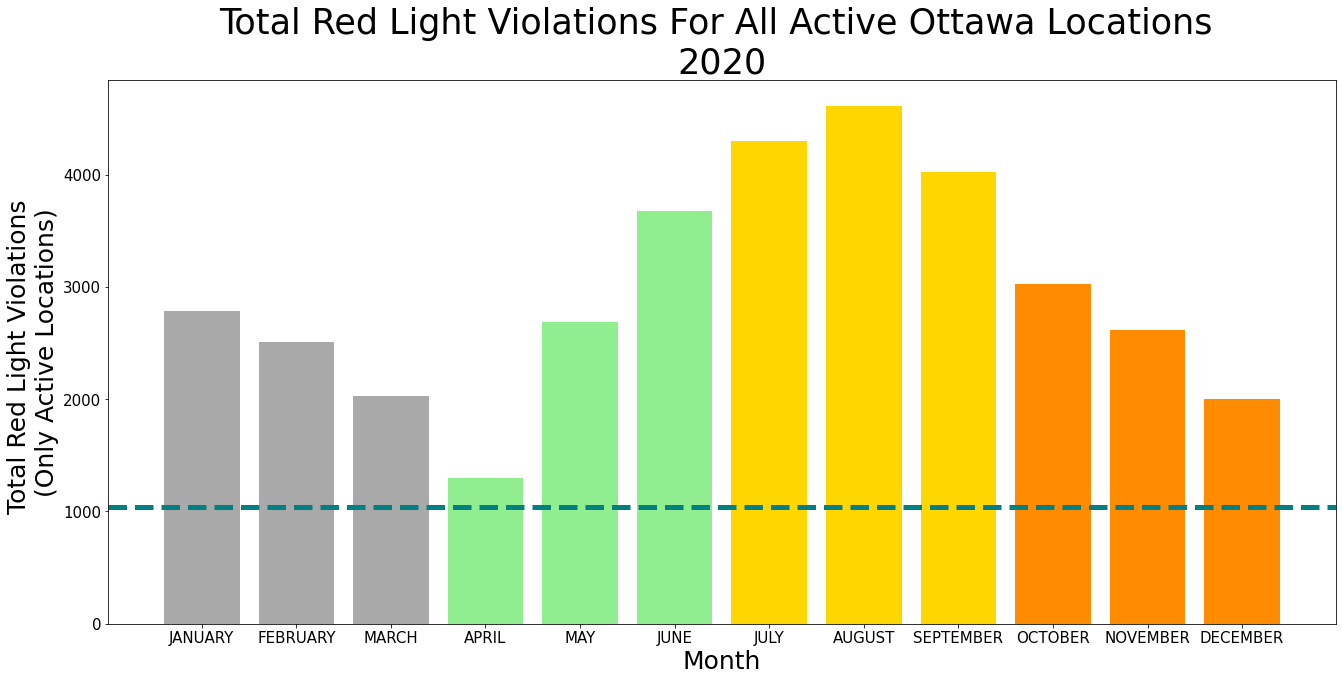
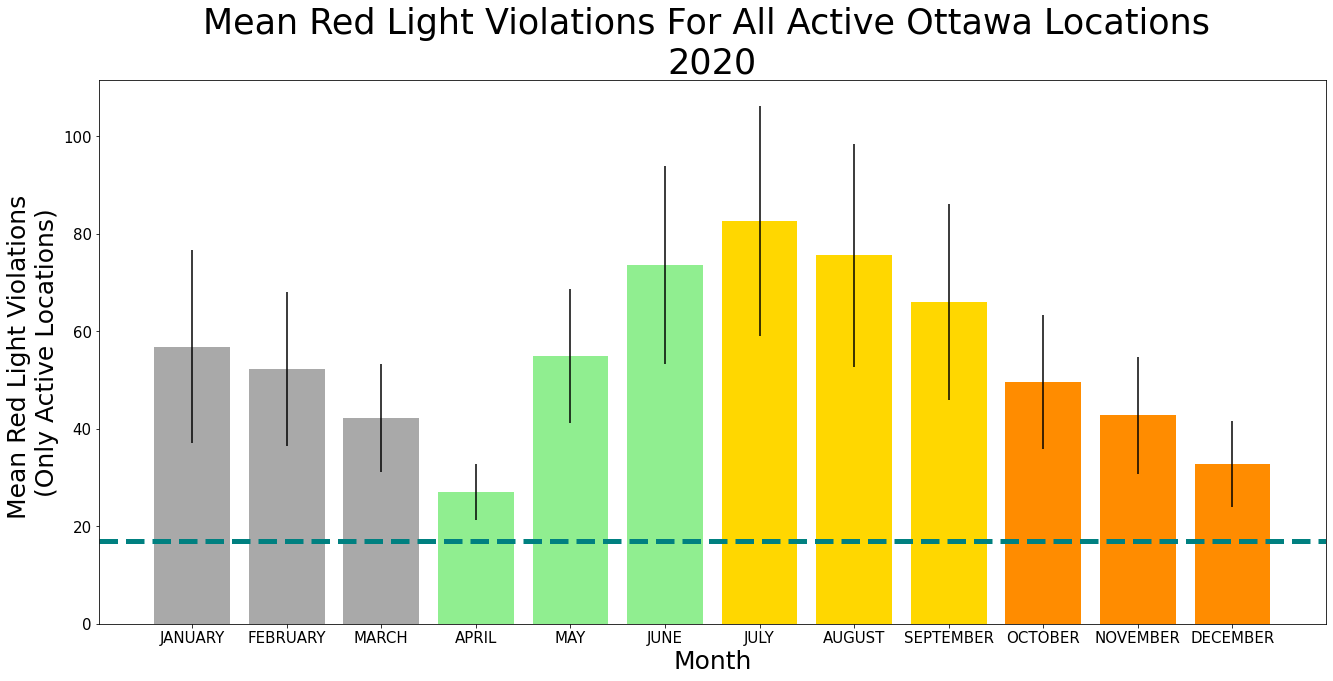
As can be seen all months do surpass both the mean (17 violations) and the total (1037 violations) violations.
Findings for 2016-2020 - excluding null values from the data set:
In this data set there are 281 cameras, meaning that we would expect 4777 total violations per month and 17 violations on average per month to breakeven.
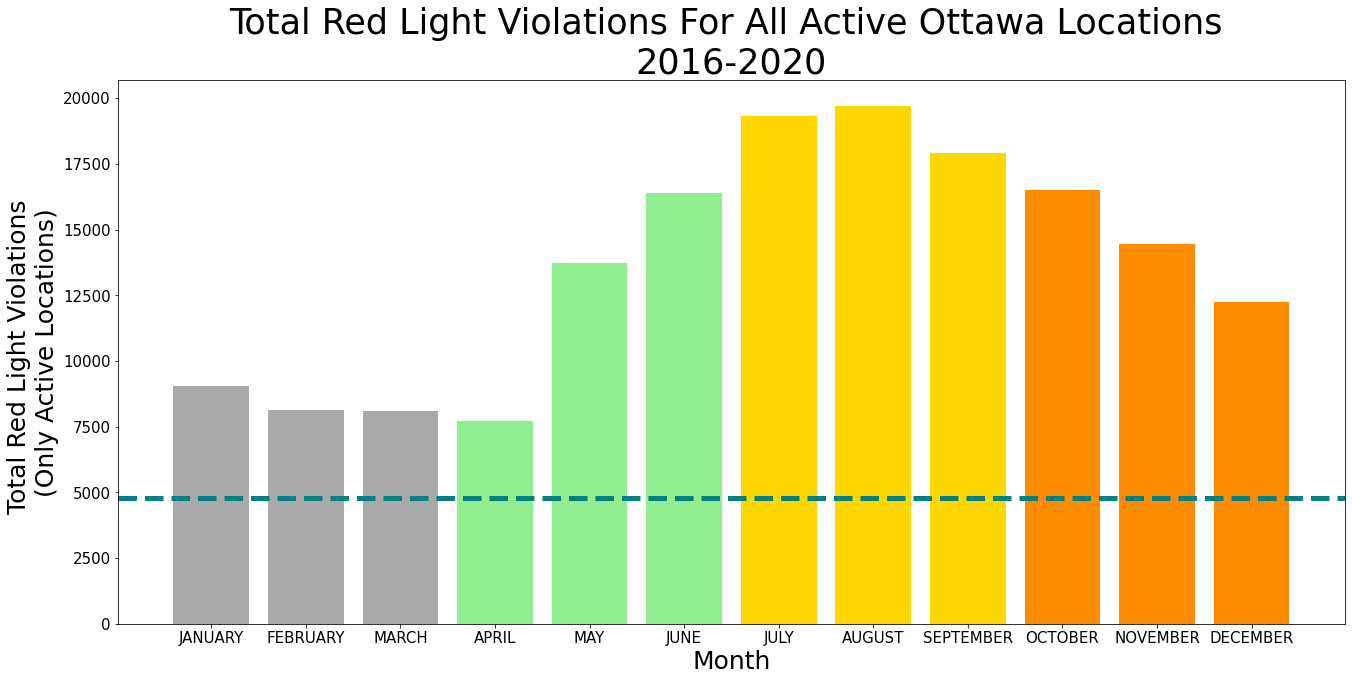
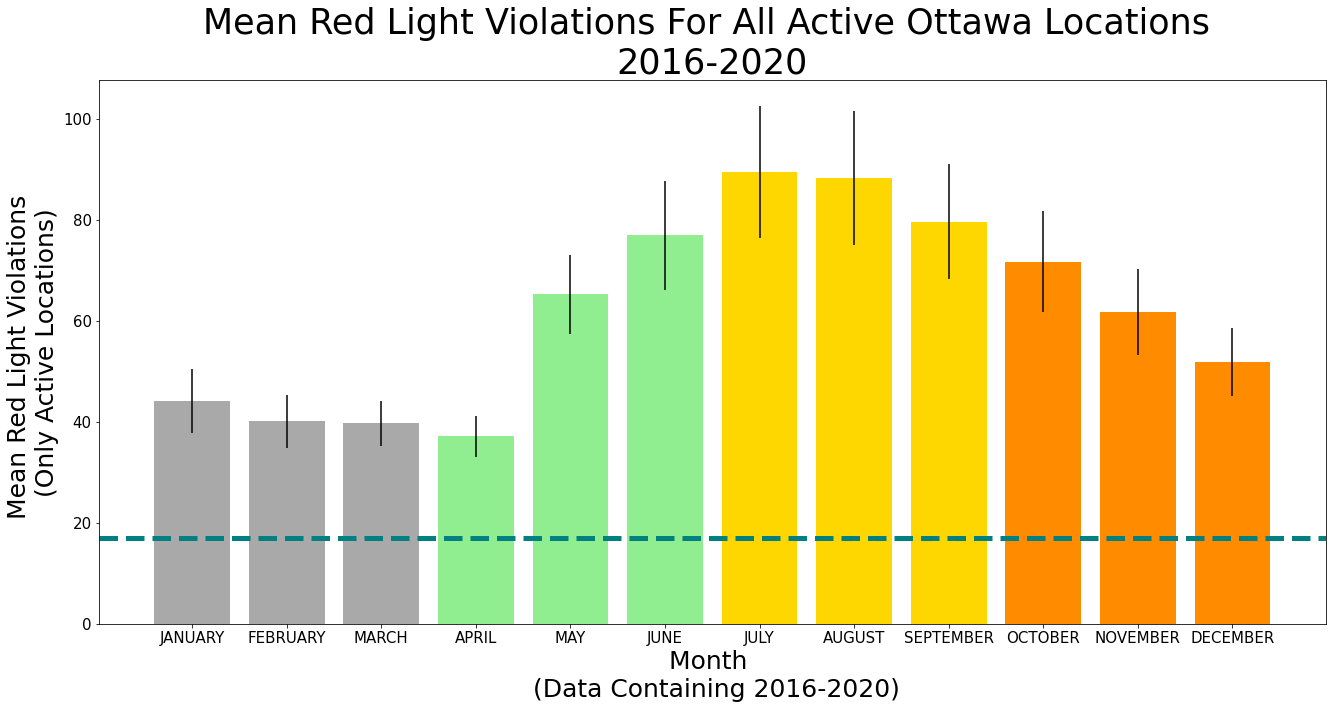
As can be seen all months do surpass both the mean (17 violations) and the total (4777 violations) violations.
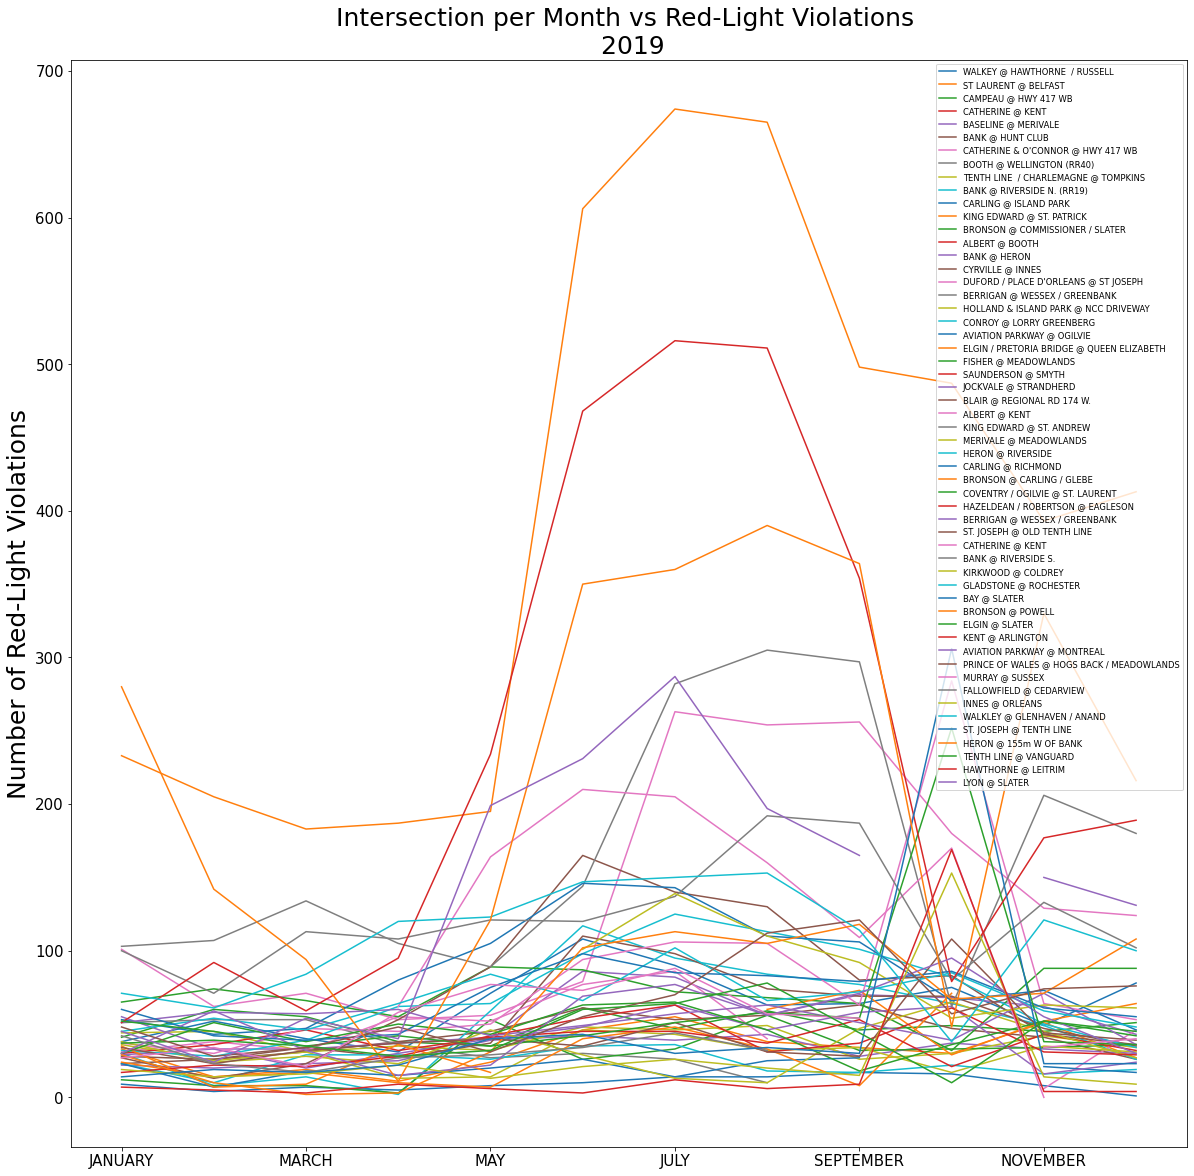
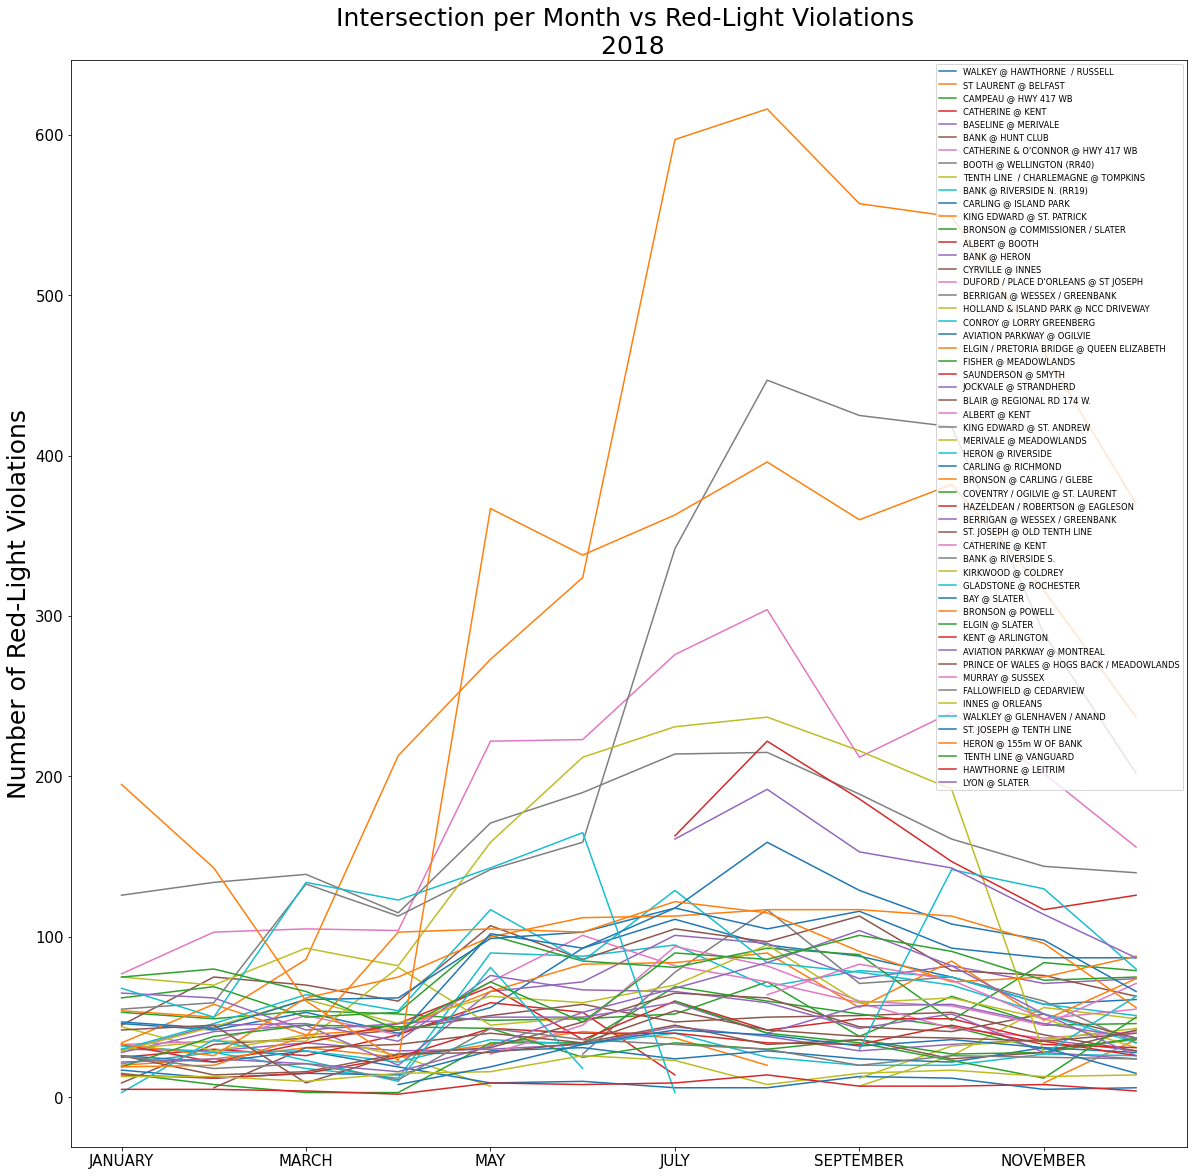
As can be seen in the data below, for all three cases, we did see an increase in the summer months. When comparing the 2020 data versus the 2016-2020 data, we see a very similar trend where summer has the most violations. What is interesting to note is that when taking into account more years, the winter violations seemed to be further decreased in relation to the other months.
As the data is limited, we can only speculate what causes this increase in redlight violations. Some of my theories are:
We want to analyze this to see which locations provide the most revenue to ensure they are maintained the most. We also want to know which locations have the least violations, to see if they are worth maintaining. If there are locations that are not worth maintaining it would be wise to look into removing the red light cameras and moving them to a more prominent and more strategic location.
The downtown neighbourhood (and directly surrounding areas) will have a higher number of redlight violations as it is a busier neighbourhood.
Each location should have approximately 204 violations total in the whole year to breakeven. This would mean we would look at total violations of 204 and monthly mean of 17 per camera location to breakeven.
Monthly mean and highest monthly total here are extremely correlated (Pearson’s r = 0.9789 for grouped by location regardless of year data and r = 0.9412 for the data for each individual location and year), so for the purpose of this project monthly mean was used. Also the correlation between total violations and monthly mean was relatively high (Pearson’s r = 0.9124 for grouped by location regardless of year data and r = 0.9342 for the data for each location and year). However, it is still important to explore the top and bottom locations for both the monthly mean and the total violations because this will give us more insight into locations that could have a higher yield in revenue. It would be wise to analyze the monthly mean, to ensure that we are getting a picture of the average that is not affected as greatly by outliers. The total violations are also important to analyze because at the end of the day we would like to know which locations are financially worthwhile overall.
Top 10 Mean/Total violations:
Bottom 10 Mean/Total violations:
Top 20 Mean/Total violations:
Bottom 20 Mean/Total violations:
Mean/Total All Heat Map:
Interpretation:
As can be seen in the visual displays of the data (Figures 5-9) , the main locations that have the most violations are downtown (Centretown and Lowertown) and the Alta Vista area. While the areas that have the lowest violations are the suburbs: Kanata, Barrhaven, and South Keys.
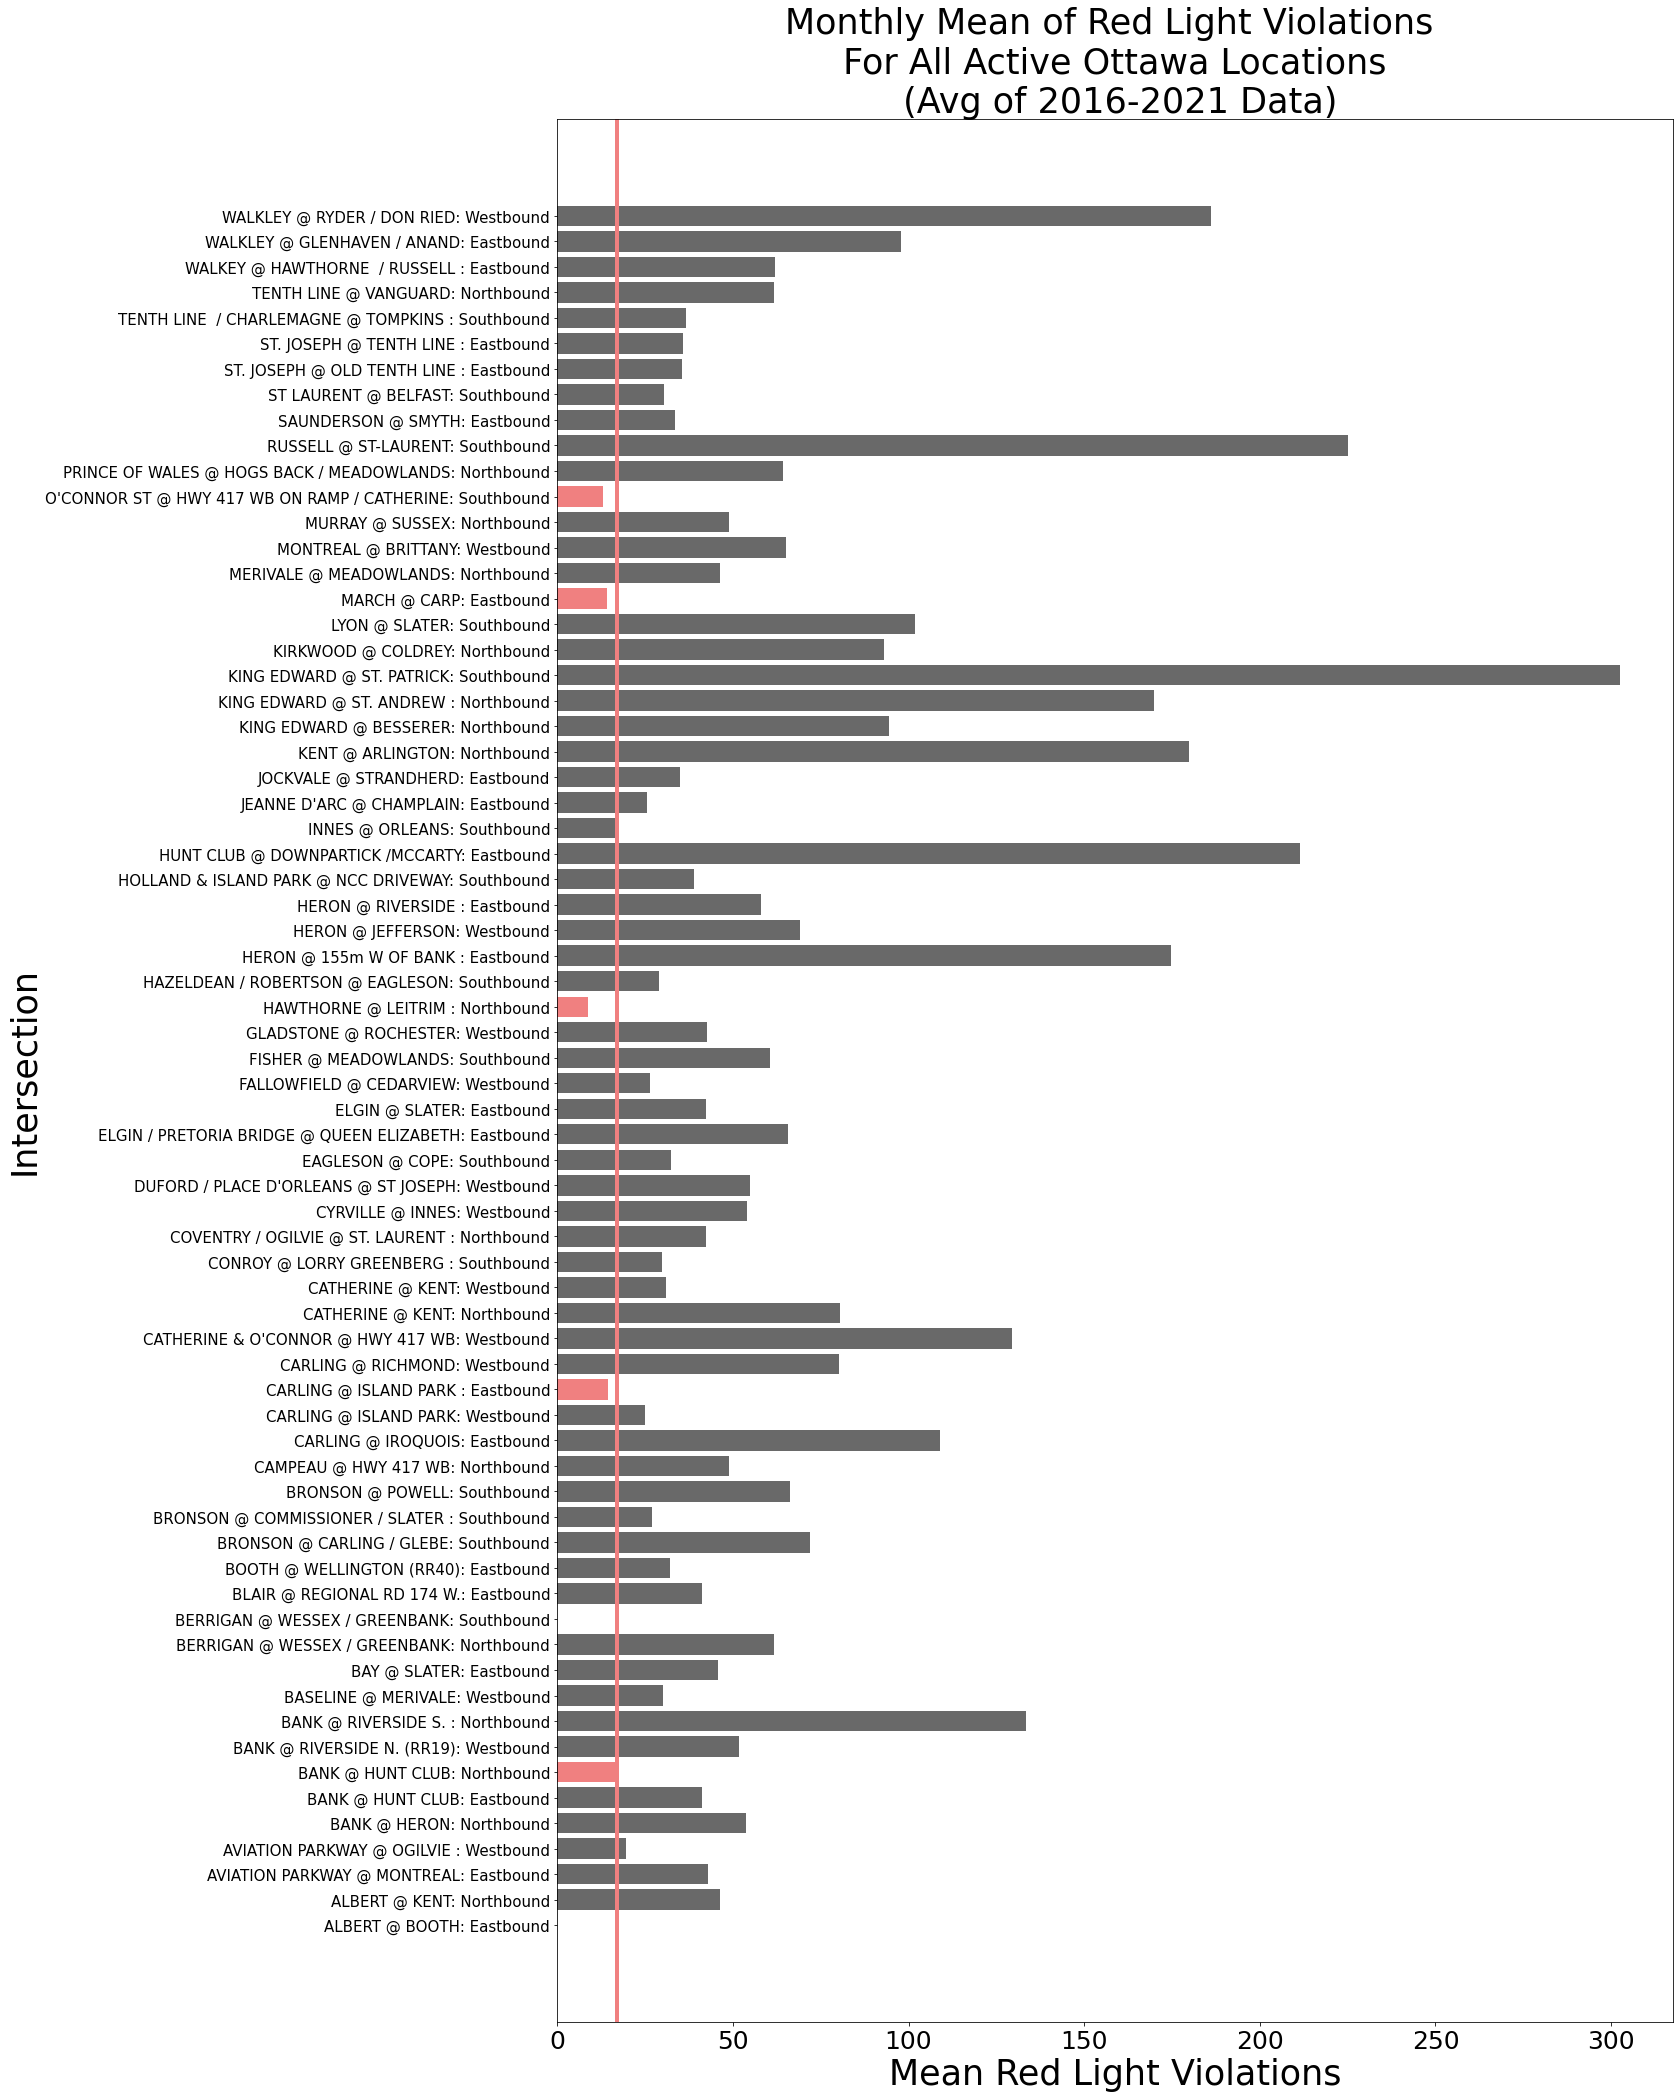
Grouped Mean/Total violations Horizontal Bar Graph:
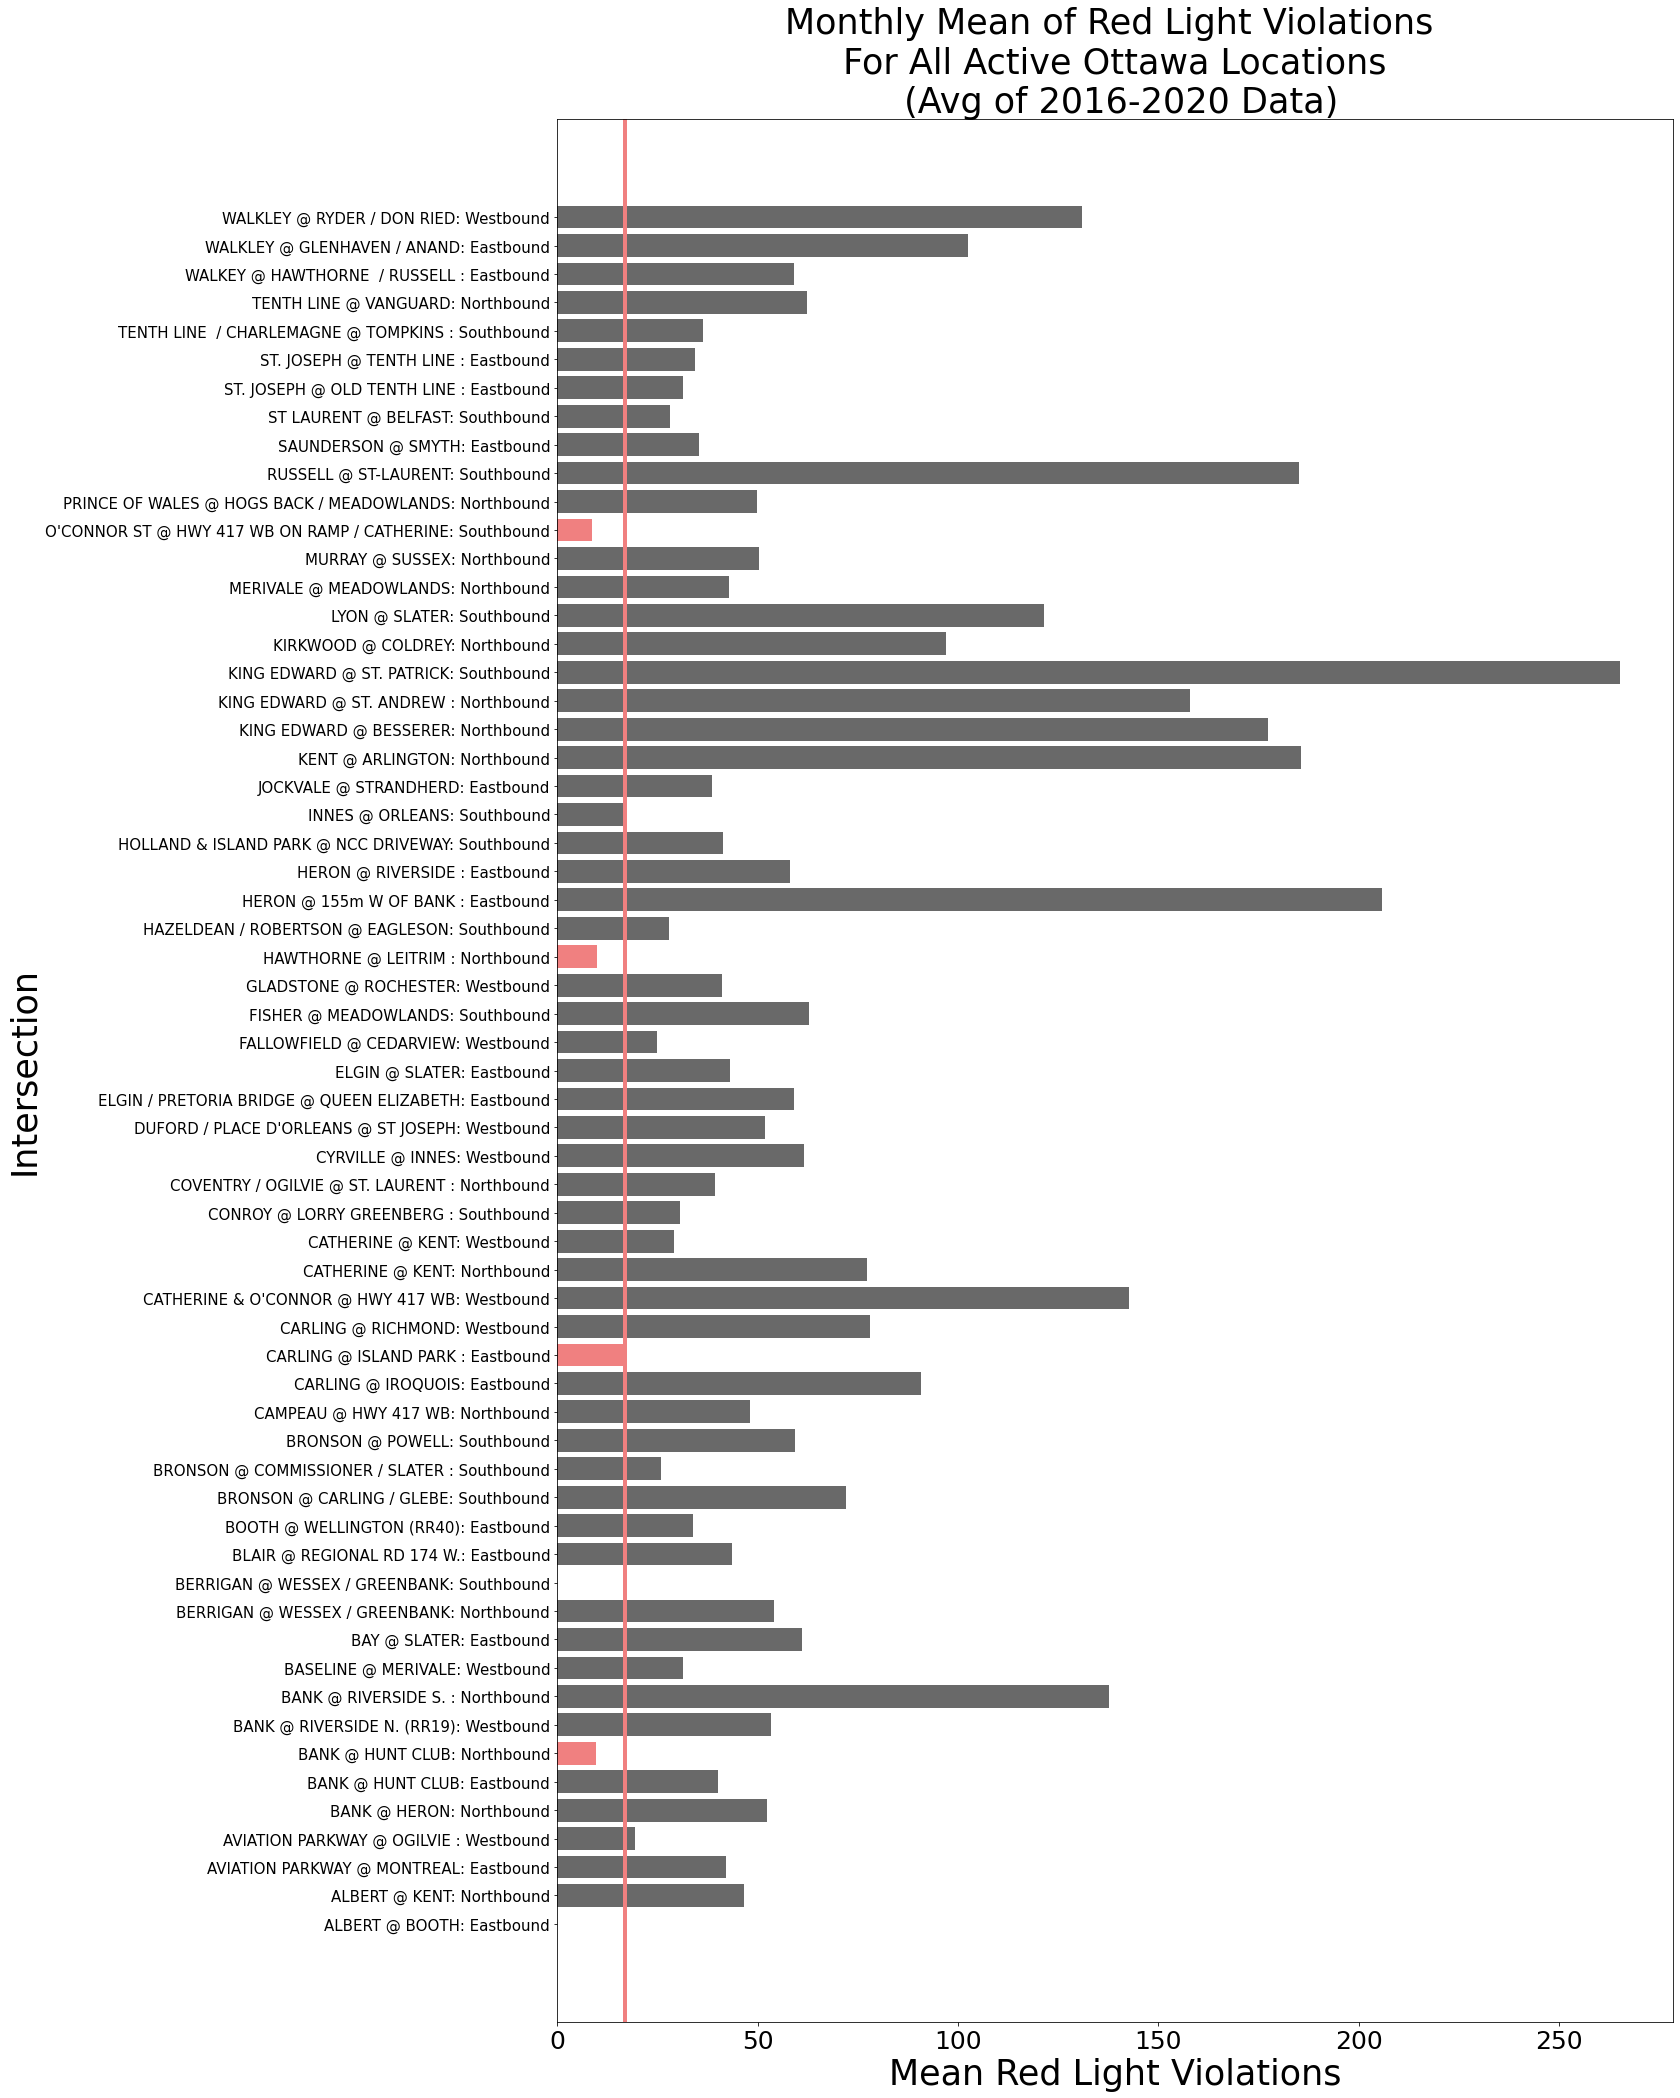 Figure 10a: Each location (2016-2020 data has been combined using mean) with the corresponding monthly mean violations.
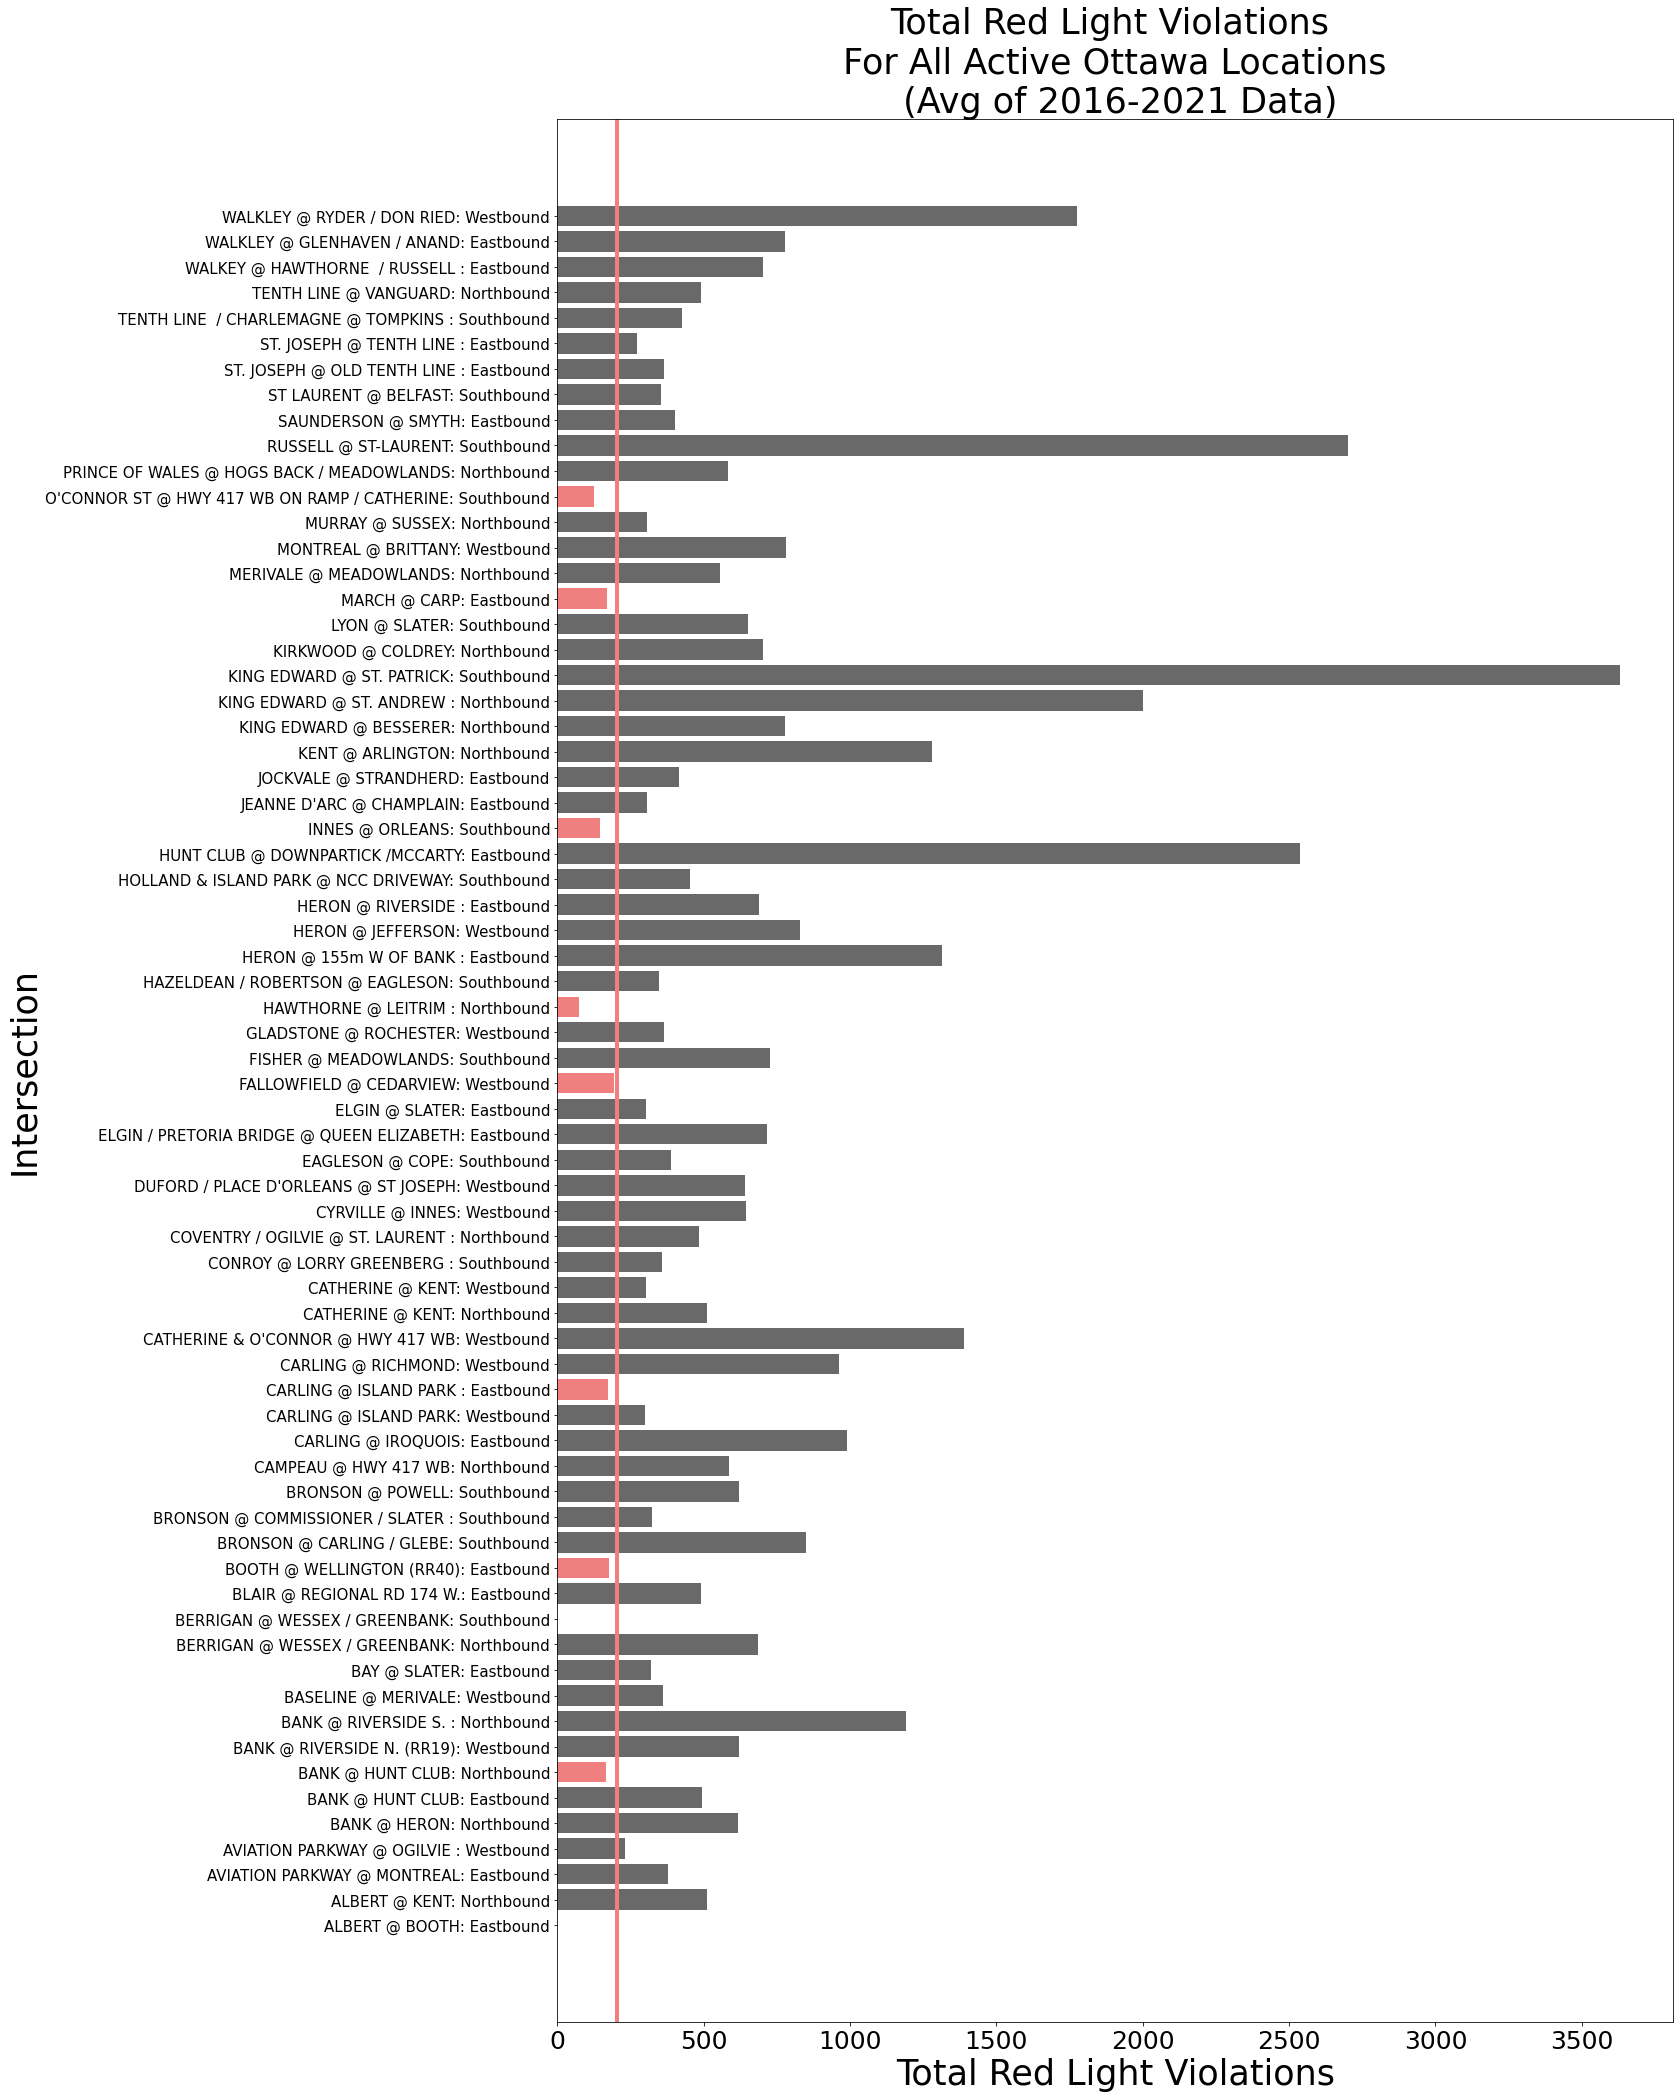
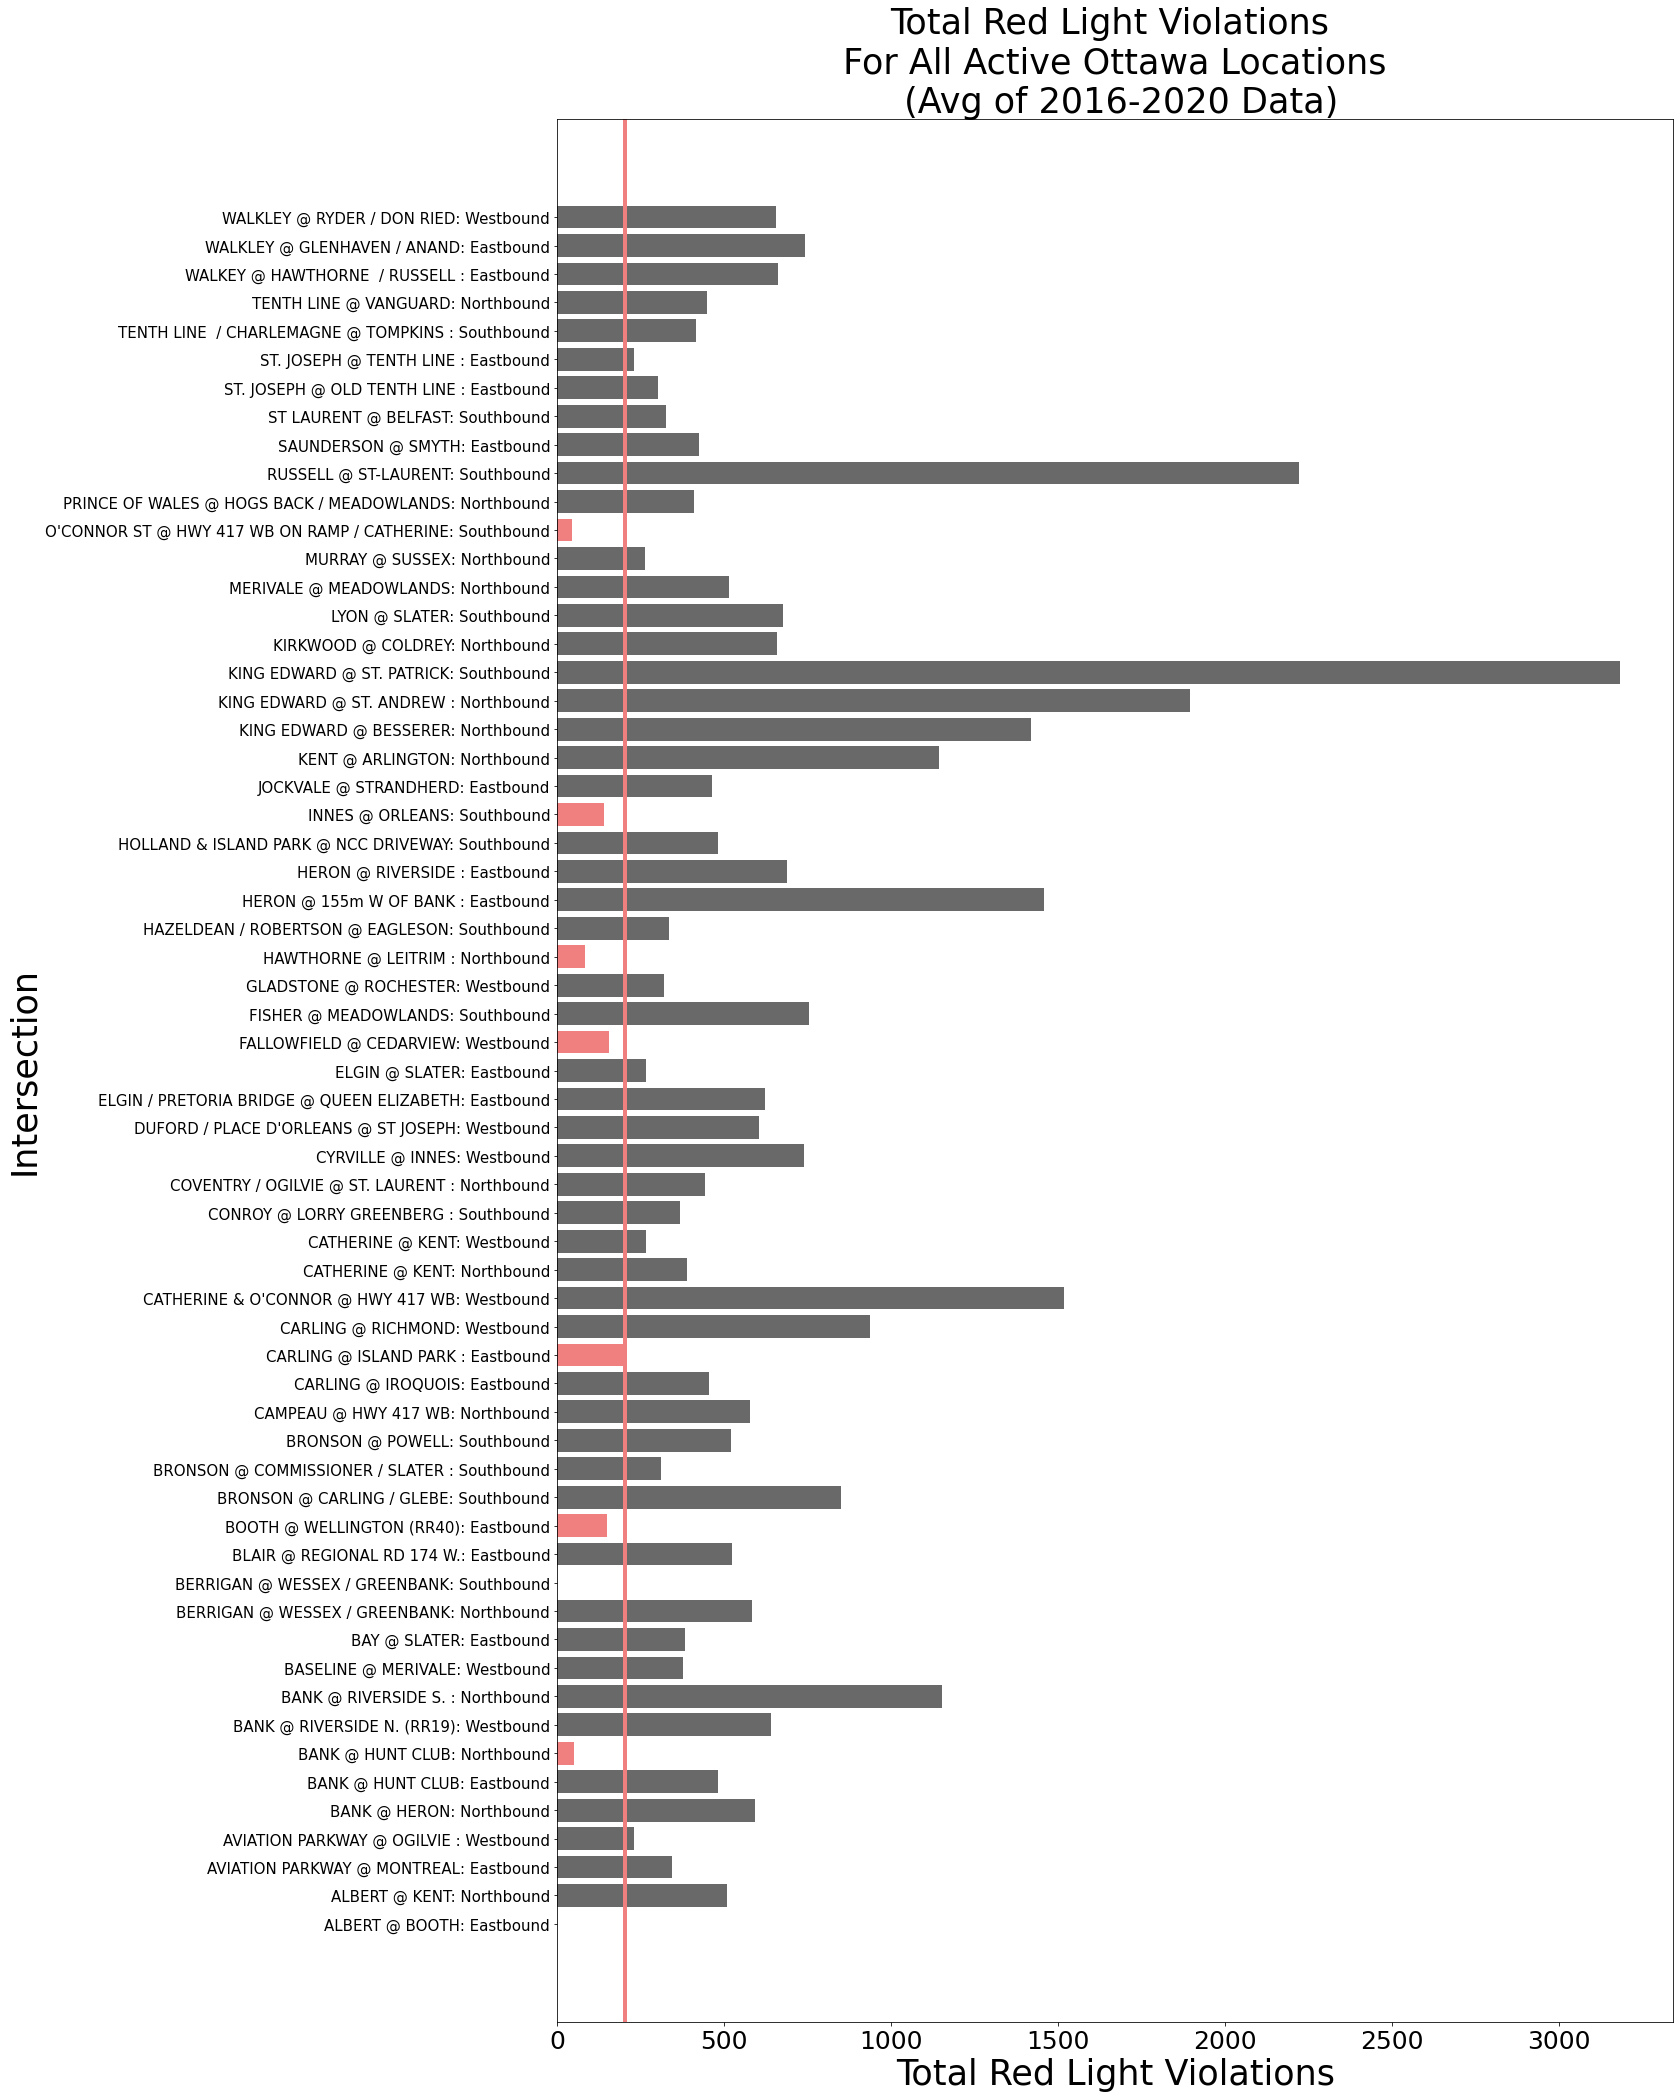 Figure 10b: Each location (2016-2020 data has been combined using mean) with the corresponding total violations.
Interpretation:
The locations which do not breakeven using the average for years 2016-2020 for monthly mean:
All Locations Horizontal Bar Graph:
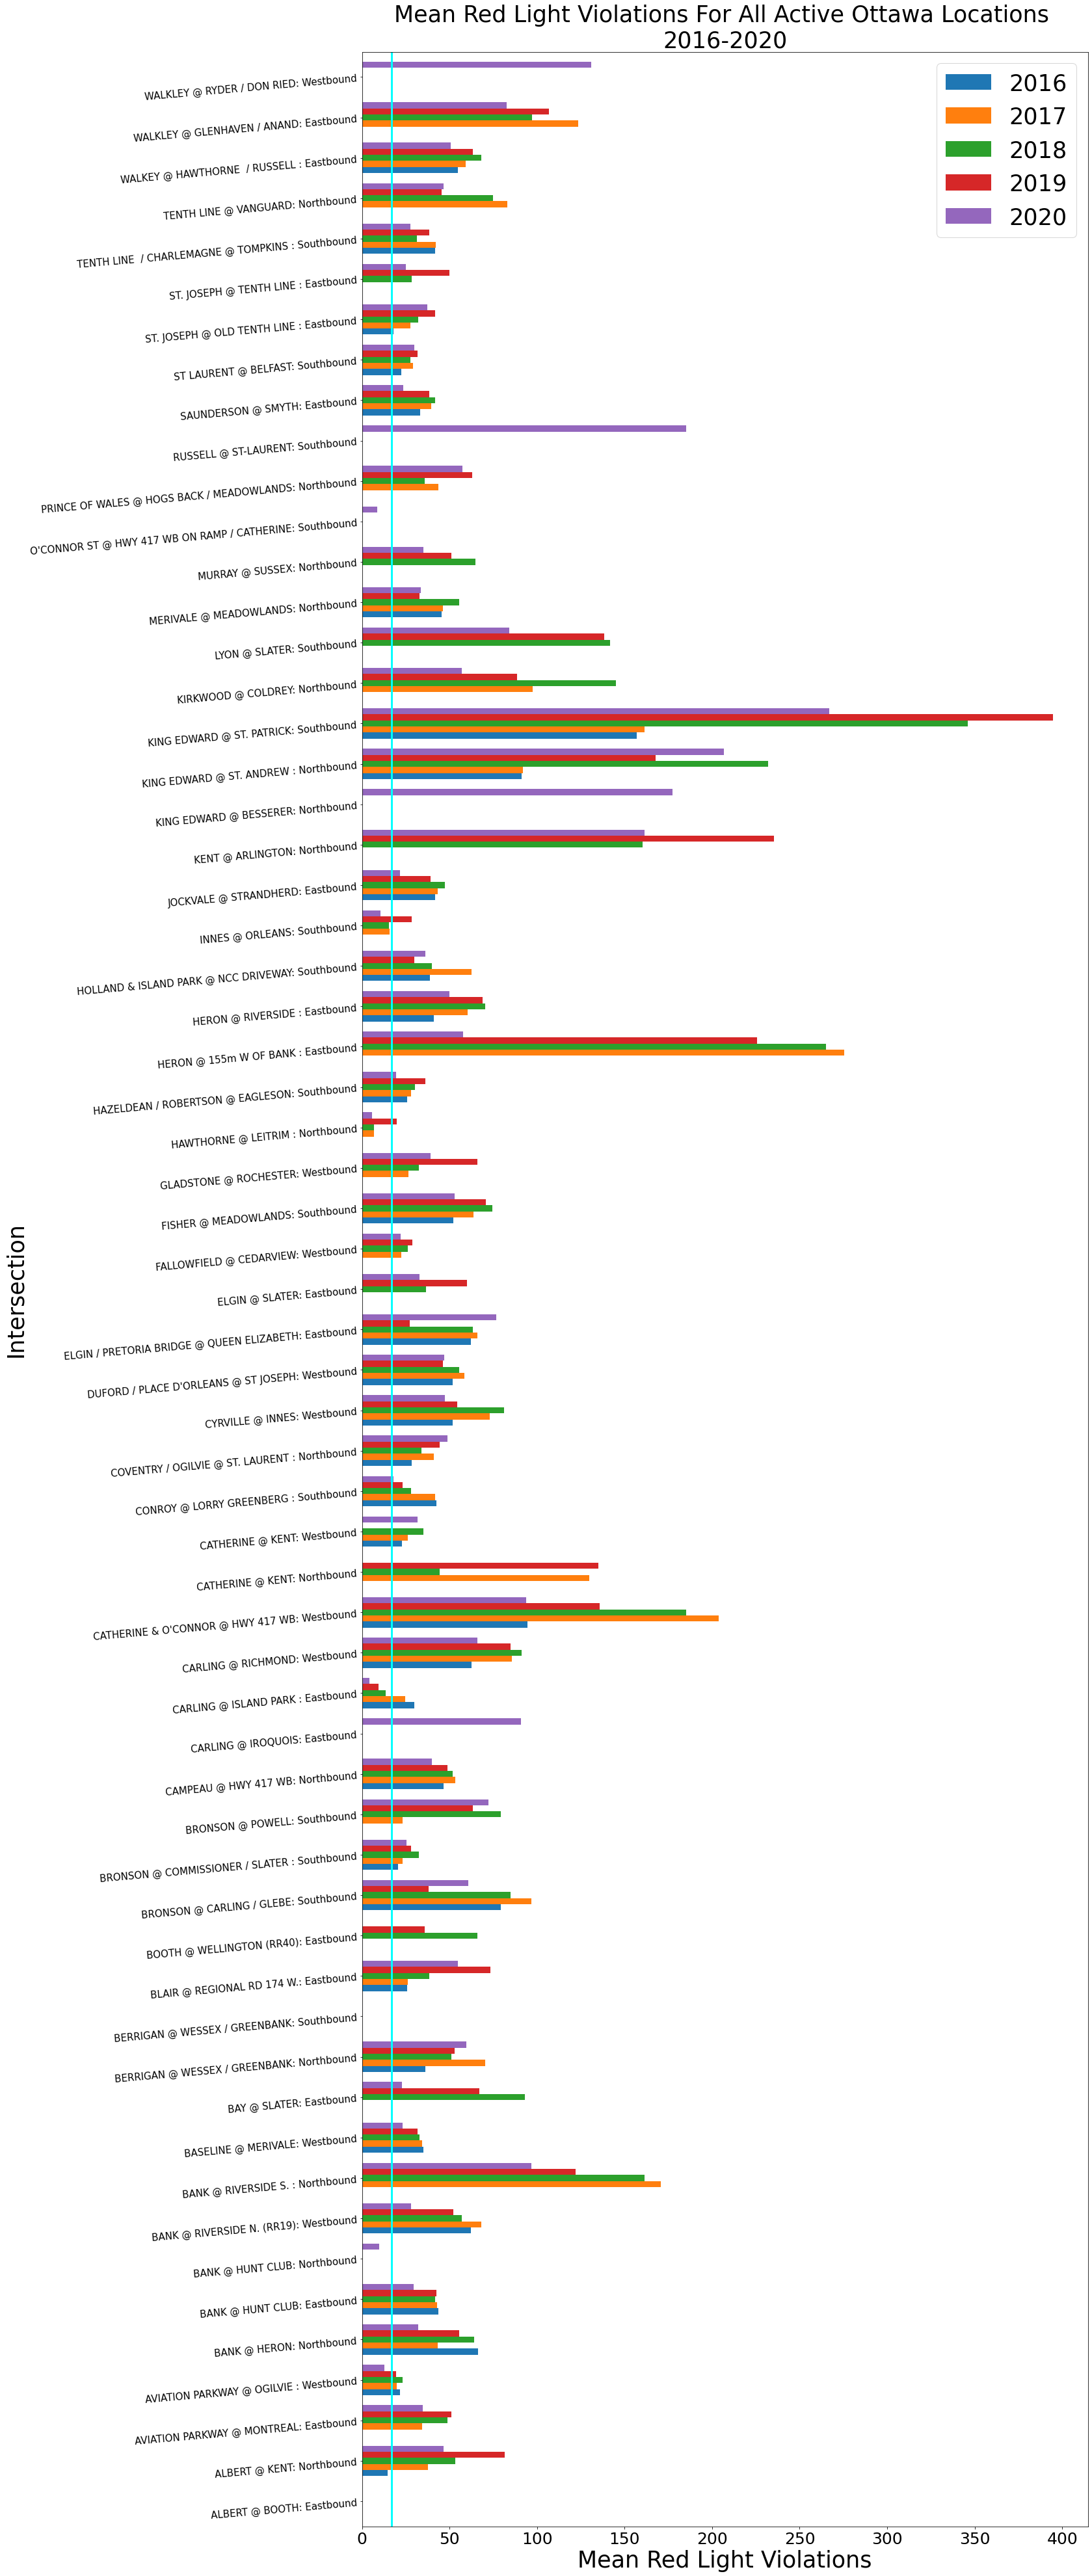
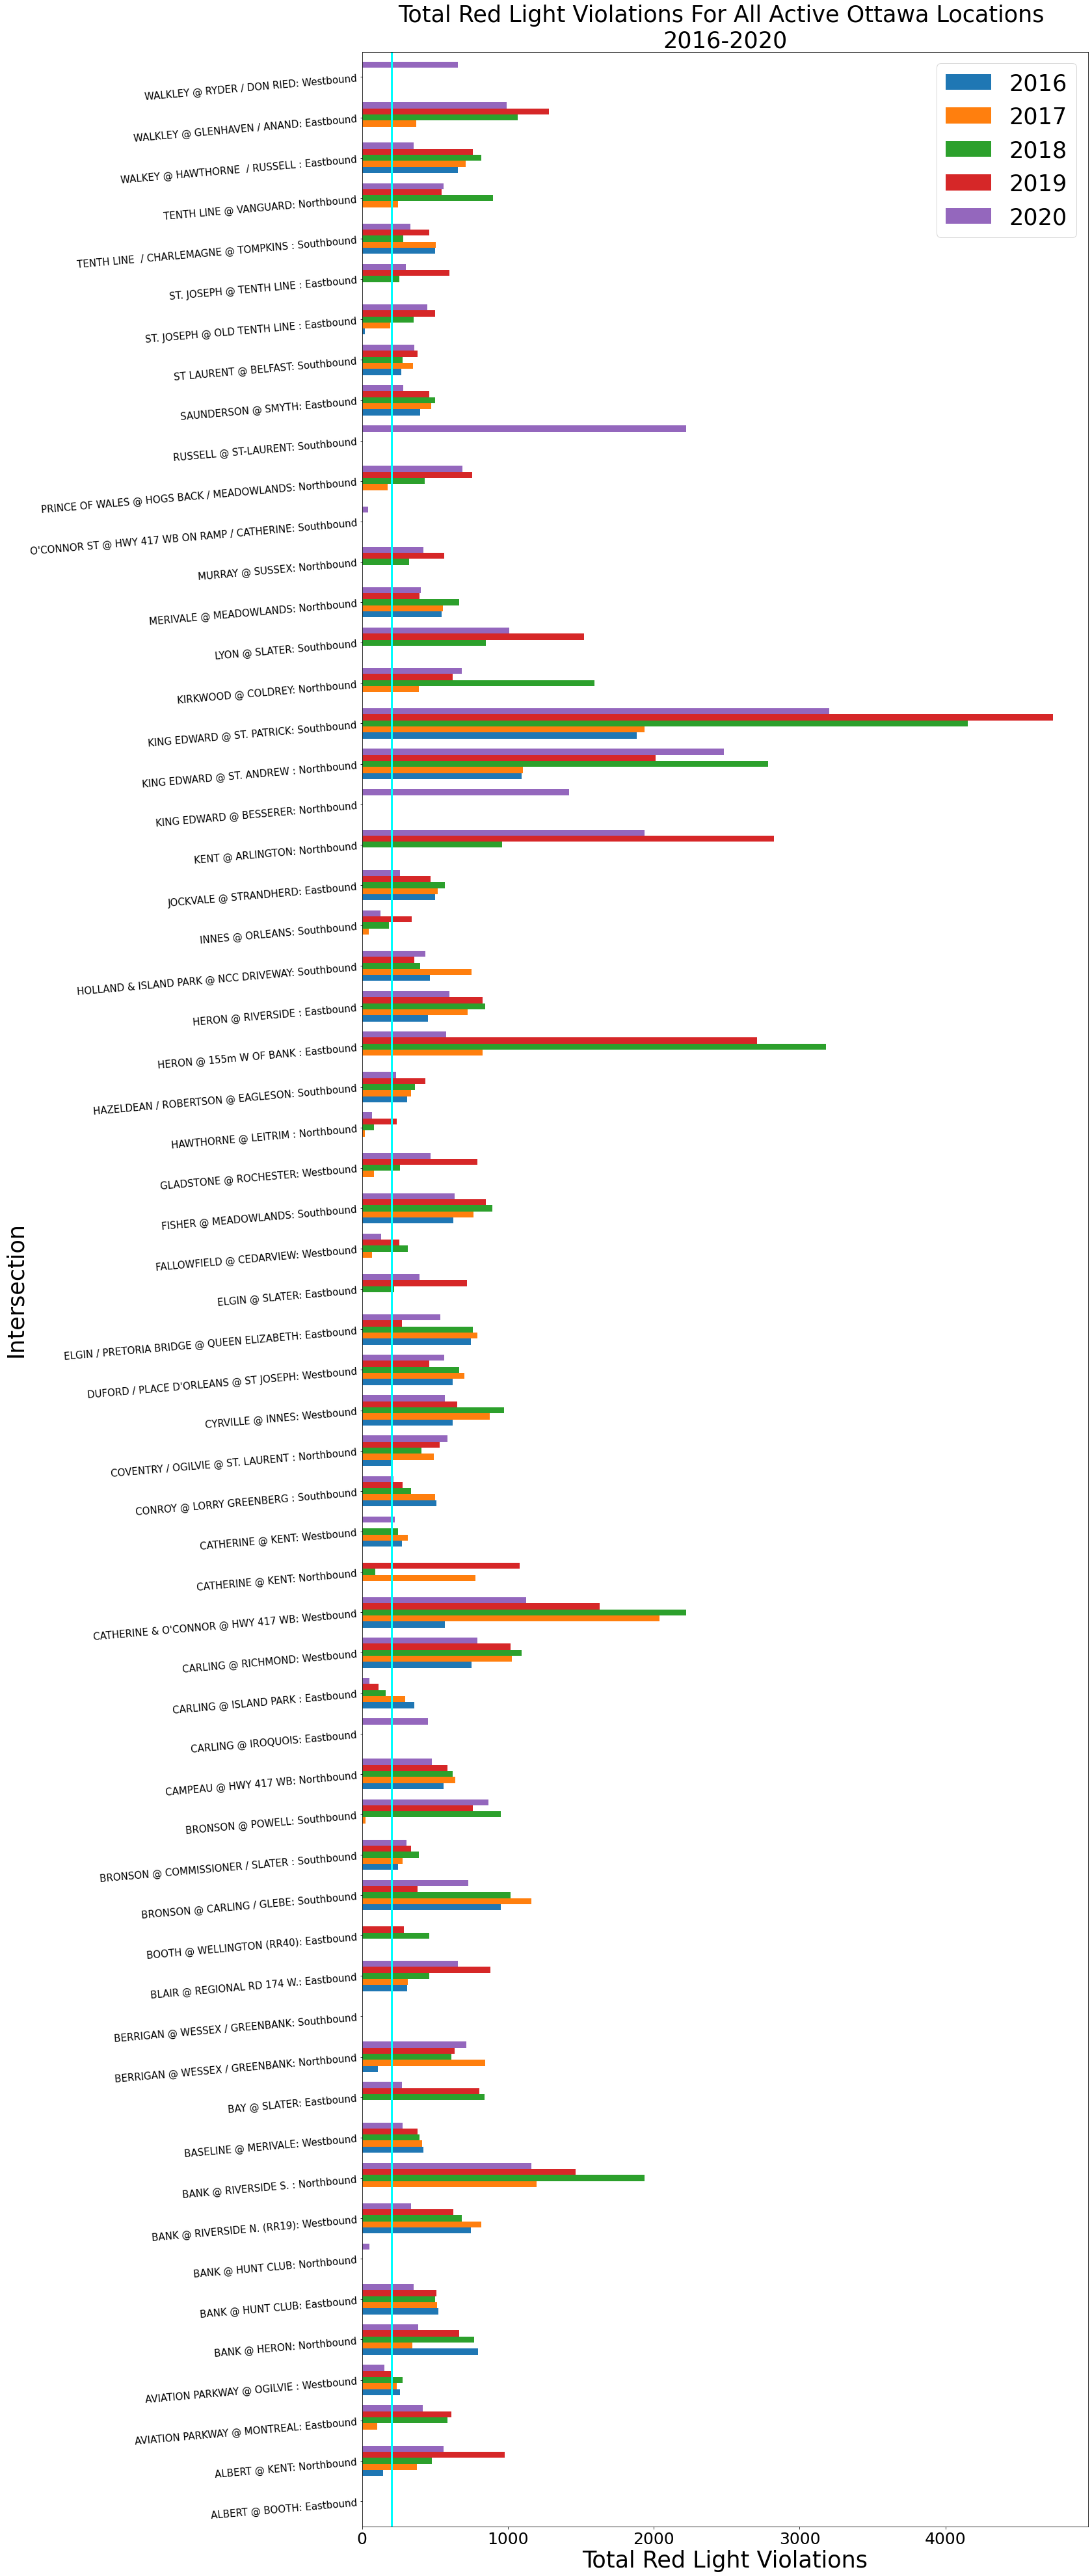
Interpretation:
Looking at the data (Figure 11) using all years and taking the locations that did not breakeven from the grouped data (Figure 10) we can see that the same locations still did not breakeven:
We can see from the above locations, upon further inspection that:
Through the outliers analysis there were a couple of interesting findings:
Cameras to Consider Removing
The following locations did not breakeven and should be examined about whether it is beneficial to still keep the cameras at that location or potentially move it to different locations:
| Location and Installation Year |
Total Violations 2020 |
Monthly Mean 2020 |
Revenue for 2020 ($260 per violation) |
Money Lost 2020 (Breakeven point: $4,416.67 per month and $53,000 per year) |
Years of Negative Profit |
|---|---|---|---|---|---|
| Carling @ Island Park: Eastbound; 2008 |
Monthly Avg: $1,105 Total: $13,260 |
Monthly Avg Loss: $4,416.67 - $1,105 = $3,311.67 Total Yearly Loss: $53,000-$13,260= $39,740 per year |
2018, 2019 and 2020 all fall below the breakeven threshold |
||
| Hawthorne @ Leitrim: Northbound; 2017 |
Monthly Avg: $1,516.67 Total: $18,200 |
Monthly Avg Loss: $4,416.67 - $1,516.67 = $2,900 Total Yearly Loss: $53,000-$18,200= $34,800 per year |
Since install 2017; October 2019 had a data anomaly which seems incorrect, so this will not be included towards the profit. |
||
| Innes @ Orleans: Southbound; 2017 |
Monthly Avg: $2,708.33 Total: $32,500 |
Monthly Avg Loss: $4,416.67 - $2,708.33 = $1,708.34 Total Yearly Loss: $53,000-$32,500 = $20,500 per year |
Since install 2017; October 2019 had a data anomaly which seems incorrect, so this will not be included towards the profit. |
Locations to track how 2021 goes, because have started to show trends of decreasing:
| Location | Total Violations 2020 |
Monthly Mean 2020 |
Revenue for 2020 ($260 per violation) |
Money Lost 2020 (Breakeven point: $4,416.67 per month and $53,000 per year) |
Years of Negative Profit |
|---|---|---|---|---|---|
| Aviation Parkway @ Ogilvie: Westbound |
Monthly avg: 3358.33 Total: 40300 |
Monthly Avg Loss: 4416.67 - 3358.33 = $1,058.34 Total Yearly Loss: 53000-40300= $12,700 per year |
Only 2020. 2019 was very close to not breaking even (total = 213, mean = 19.363636) |
||
| Conroy @ Lorry Greenberg: Southbound |
Monthly avg: 4701.67 Total: 56420 |
Monthly Avg Gain: 4416.67 - 4701.67 = $285 Total Yearly gain: 53000-18200= $3,420 per year |
None |
Cameras to Prioritize for Maintenance
The top 10 locations for both monthly means and total violations were analyzed to see which locations should be ensured they are maintained throughout the year as they yield high revenue. The following locations were active consistently for 12 months:
It is important to note that although Heron @ 155m W Of Bank: Eastbound had a consistently high number of violations since install in 2017, in 2020 it started to decline during COVID restrictions (March 2020), with a sharp decrease in April and May. This is why this location is no longer recommended to ensure it is up and running. It would be a good idea to analyze this redlight camera once restrictions from COVID have fully been removed, to see if there will be an increase in violations again.
Top 10 Locations
Below you will find a table looking at the top 10 locations for both 2020 and 2021 (using the monthly mean and the total yearly violations).
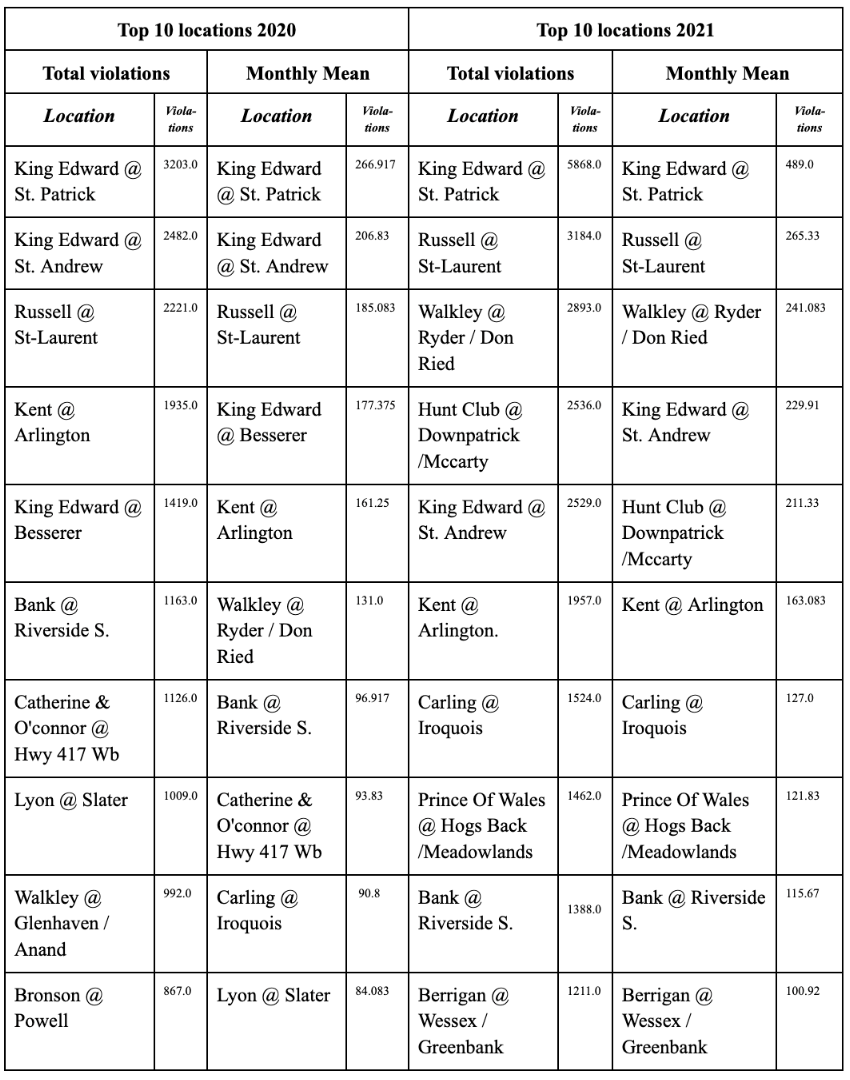
What we can see that there are some consistencies between the years, such as King Edward @ St. Patrick and @ St. Andrew, Russell @ St-Laurent, Kent @ Arlington, Bank @ Riverside S., and Walkley @ Ryder / Don Ried. But we can also see that there are some locations that have dropped out such as King Edward @ Besserer.
Breakeven Locations
Interestingly some locations only fell below breakeven for 2020, but jumped back up for 2021:
These locations still are not breaking even in 2021:
These locations are not breaking even but just starting in 2021, so stay tuned to them:
These locations are continuously zero for most years and most likely are no longer running:
Here are more detailed calculations for locations that are not breaking even (and their historical profit):
Locations consistently losing the city money:
Locations that just started losing money in 2021, to keep an eye on for next year:
Locations to ensure they are being maintained (because they always give a big return):
Locations that have a high return right now:
Most downtown locations will see a statistically significant drop in the number of violations in 2020 because there were less people travelling from their homes due to COVID lockdowns and restrictions. Ottawa is a very government employed city, and since the majority of workers were sent to work from home, I would expect downtown to not have nearly as much traffic as it normally does.

We can see that downtown has locations which have decreased, but in relation to how many cameras are found downtown, there wasn't as big of a decline as can be seen with Alta Vista. Alta Vista was hit the hardest with decreases. We can also see that Kanata (all cameras) and Gloucester (1/2 their cameras) also had a relatively high number of decreases (when compared to how many camera locations they have). Alpha level 0.05 was selected as this is the most common threshold for statistical significance.
My hypothesis was not supported with the data. The location which seemed to have the largest decreases was Alta Vista (almost all of their cameras had seen a significant decrease -which can be seen in Figure 15. Also notable is that Kanata and Gloucester were also part of the locations that had a noticeable decrease in violations. Kanata had both of their cameras showing a significant decrease and Gloucester having half of their cameras showing a significant decrease.
This decrease in violations could be due to the COVID restrictions which probably led to more people staying at home meaning less people driving. Another reason for this occurrence could be due to the fact that red-light cameras are hypothesized to decrease violations the longer they are kept in place, meaning this could be a natural decrease in violations that we are seeing. In order to find which cause it most likely is, more research would need to be done.
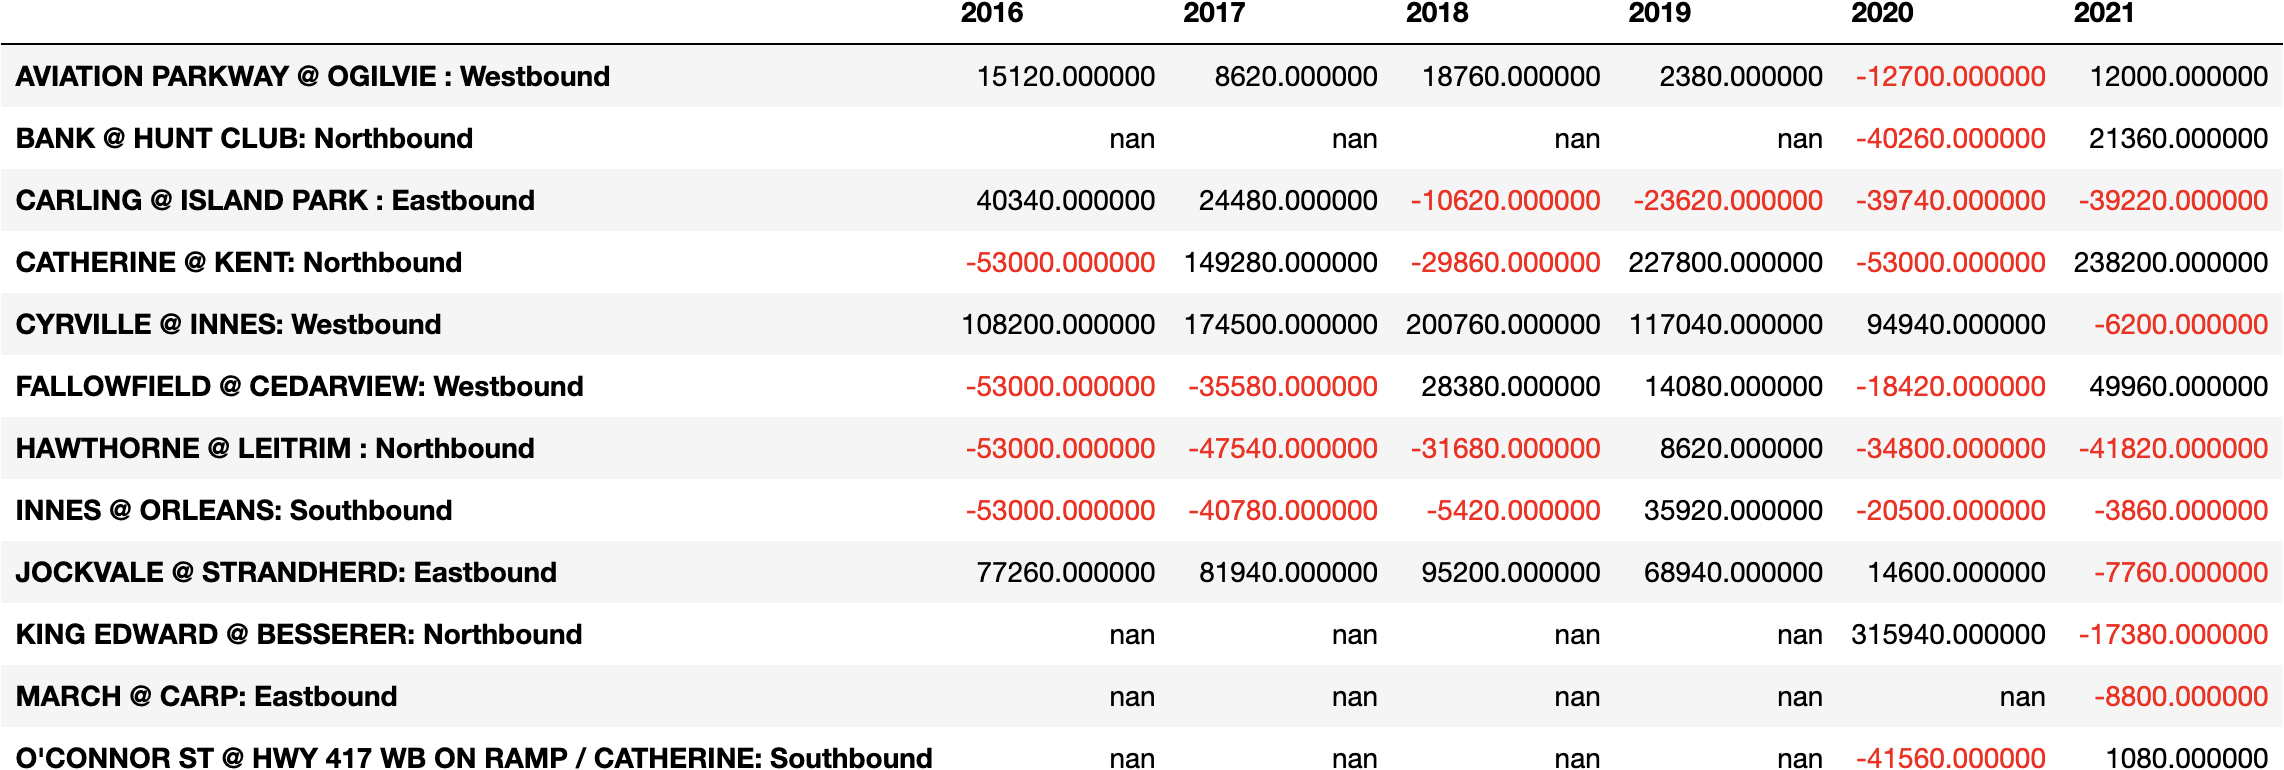
Number of locations that are statistically significantly different:
Table: Looking at violation count changes that are statistically significant by location - p-values less than 0.05 (p-values that are greater than 0.05 are blacked out). Red box means a decrease between years highlighted; green means an increase.
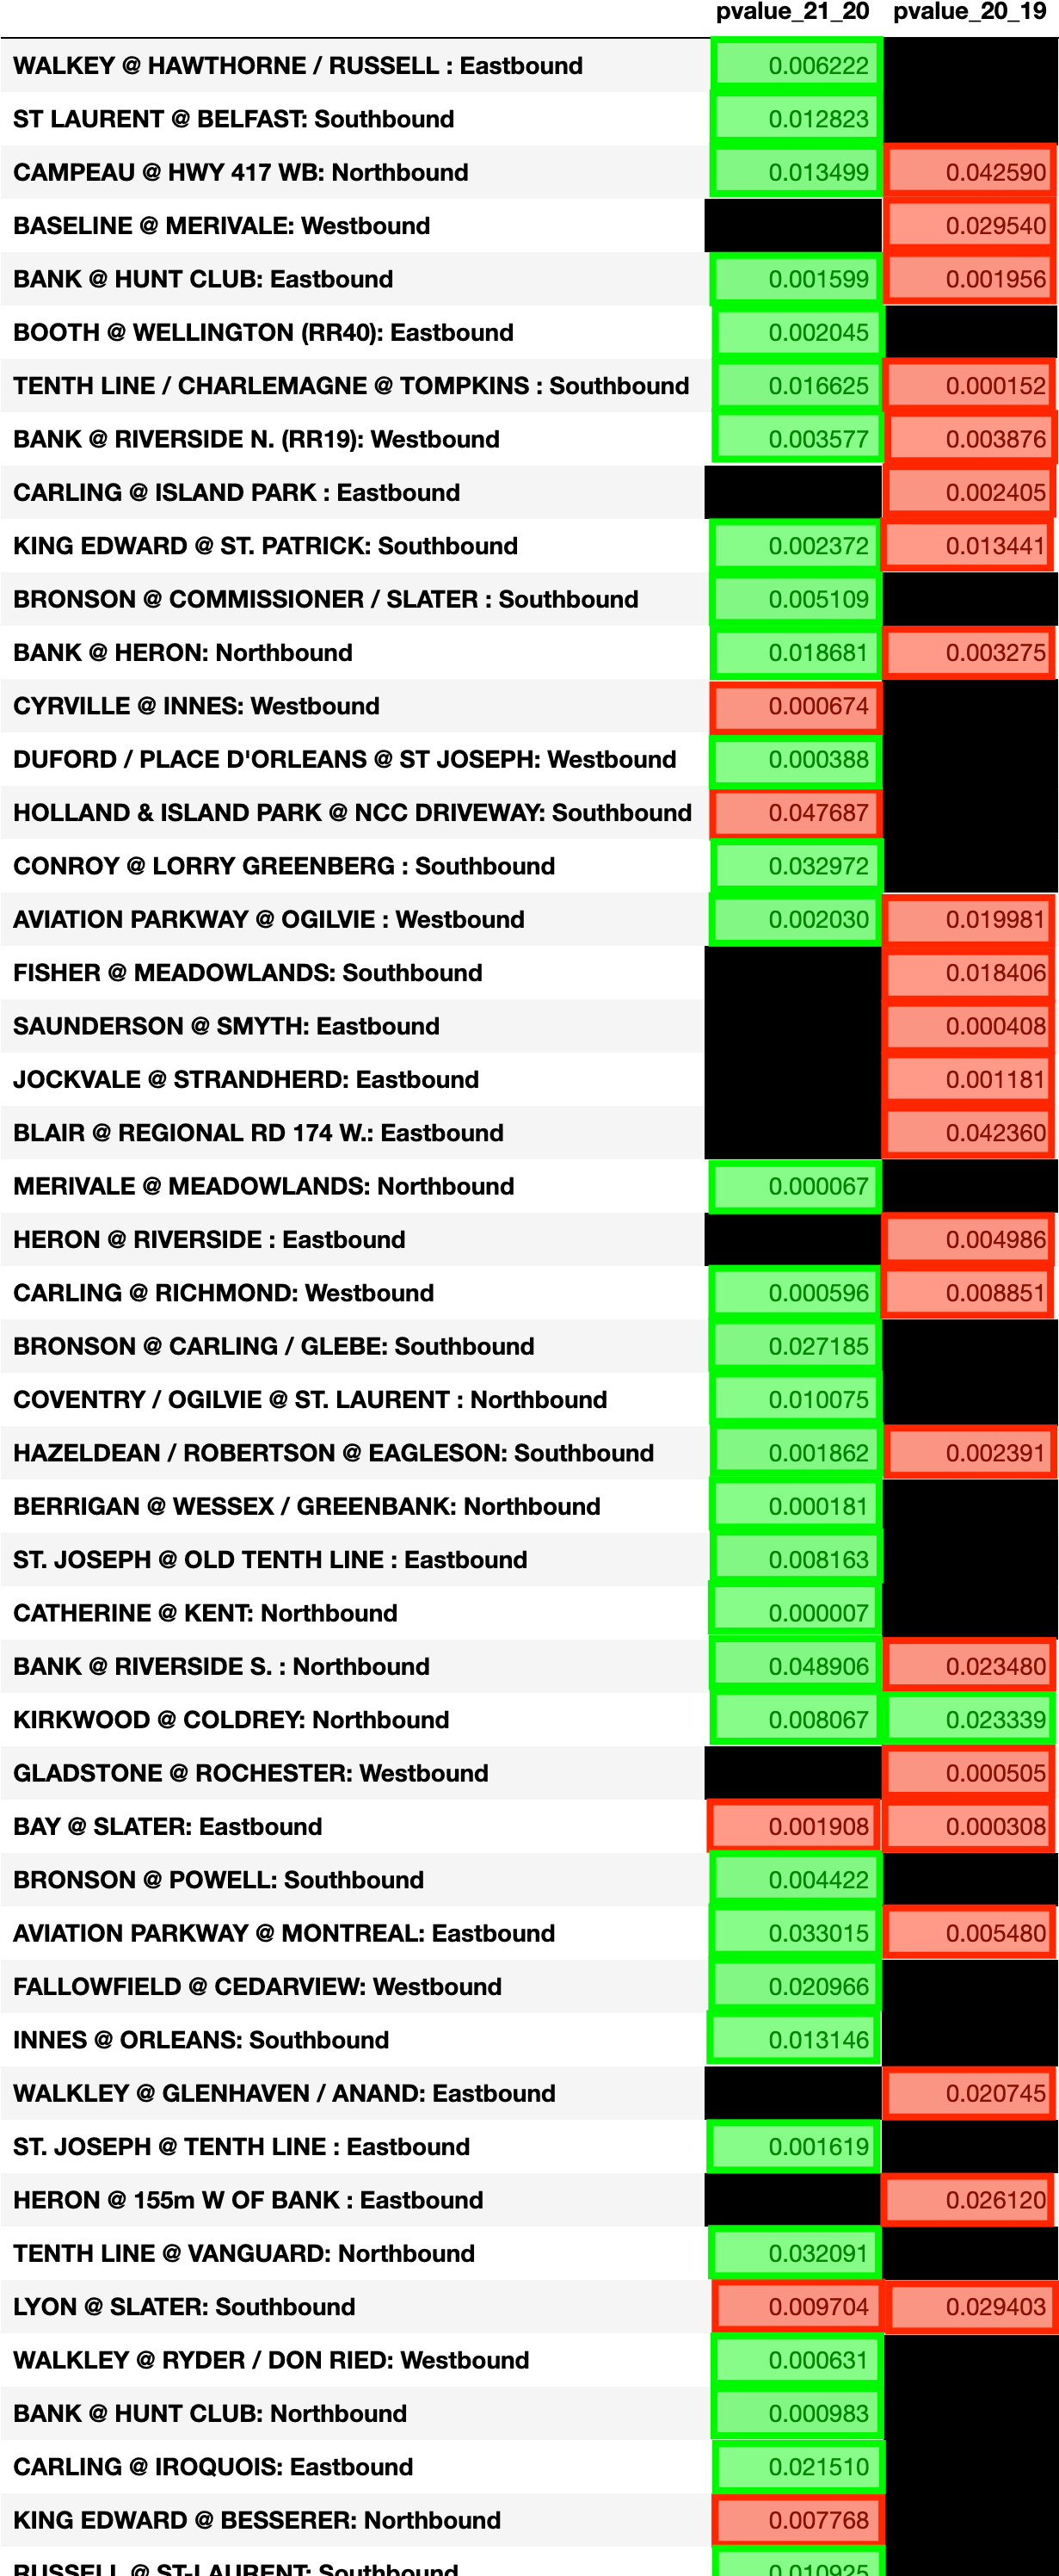
From 2019 to 2020 we can see all are decreases, except:
From 2020 to 2021 we see majority are an increase except:
There were 11 locations which saw a statistically significant decrease from 2019 to 2020 but then saw a statistically significant increase from 2020 to 2021: